SaaS Product Analytics: Connect Feature Usage to Revenue and Retention

Your engagement dashboard looks healthy. DAU is up, feature adoption is at 40%, retention curves are holding. Then the CEO asks the question you can't answer: "Which of these features actually drives revenue?"
You open Amplitude. You can see who used what and how often. But you can't see what they pay, what plan they're on, whether they expanded or churned, or what they told support last week. The engagement data is rich. The line to the P&L doesn't exist.
Roadmap reviews keep stalling on the same gap. "We think this feature matters" is the best anyone can say — because proving it would mean joining product events to billing data that lives in a system your product analytics tool has never seen. So investment goes to features that look popular, while features that actually drive expansion get no signal at all.
The problem isn't your product analytics tool — Amplitude, Mixpanel, PostHog are excellent at what they do. The problem is that usage and revenue live in different systems that have never been joined. This guide is the build order for connecting them: what to decide first, what to set up second, and what you can skip entirely at your size.
One disclosure before we start: Definite is an all-in-one data platform with an AI agent called Fi, and we'll show each step working in Definite as the running example throughout. The framework itself is tool-agnostic — you could execute it with a warehouse and a hired analyst. The argument of this post is that you shouldn't have to.
The system in brief:
- Start from the revenue questions your leadership actually asks — which features drive retention, what predicts churn, where the roadmap should invest — not from the usage data you happen to have.
- Decompose a revenue-anchored north star (like NRR or active-account expansion) into a metric tree so every product metric has a reason to exist and a line to the business.
- Write a metric dictionary: each metric defined once, with a formula, the dimensions it must be cut by, a source system, and an owner. "Feature adoption is 40%" is trivia; "feature adoption is 60% for enterprise and 22% for self-serve" is a roadmap decision.
- Map every metric to its source system and solve the cross-system join — this is where product analytics actually breaks, and where AI now handles the heavy lifting.
- Build the dashboard last. Distribute answers where decisions happen — Slack, email, roadmap reviews — not in a BI tool nobody opens.
- Set a review cadence: leading indicators weekly, revenue impact monthly, roadmap evidence quarterly.
Total time with modern tooling: a weekend to stand up. No data engineer, no warehouse project.
Why your product analytics tool can't answer the question that matters
Before building anything, it helps to understand why Amplitude, Mixpanel, and PostHog — tools you probably use every day — struggle to answer "which features drive revenue." It isn't a product failure. It's structural: product analytics tools are built to track user behavior within your product, not to join that behavior to business outcomes that live in other systems.
The tools know this is a problem. Mixpanel acquired DoubleLoop specifically to "drive product-to-revenue outcomes." PostHog built a Stripe connector for in-product revenue joins. Amplitude had a warehouse-native product that could query billing data alongside events (now legacy and unavailable to new customers). Each approach proves the problem is real — and each reveals why it's harder than a feature addition: Mixpanel's revenue analytics requires your billing data to already live in a warehouse and be synced via connectors. PostHog's Stripe join requires manual identity linking between distinct_id and email. Amplitude's best shot at cross-system queries is discontinued. The vendors are retrofitting revenue capabilities, and each retrofit surfaces the same four structural mismatches:
- Identity. Your product tool tracks users by an anonymous ID or user_id. Stripe tracks billing customers. Your CRM tracks accounts. These are three different entities with three different ID systems, and nobody created the mapping between them. Until someone resolves "user_id 4782 is part of account Acme, which is Stripe customer cus_N7f2x," usage and revenue can't occupy the same row.
- Scope. Product analytics sees events — clicks, pageviews, feature usage, session duration. It doesn't see what users pay, what plan they're on, when they renewed or churned, what they said to support, or what segment they fall into. The business context that makes usage data meaningful lives in Stripe, your CRM, and Intercom.
- Grain. Product events are fine-grained (grain just means what one row represents): one user generates hundreds of event rows per session. Revenue is monthly — one row per subscription per month. Feature adoption is a rate over a period. Analyzing "does feature X usage predict renewal?" means aggregating events to the right level — by account, by time window, by segment — and joining them to a revenue outcome at the same grain.
- Timing. Product events are real-time. Revenue recognition is monthly. A feature used heavily in March might drive a renewal that shows up in June. The lag between usage signals and revenue outcomes means you need historical joins — not just what users are doing now, but what users who later renewed (or churned) were doing three months before.
None of these are criticisms of the tools. Amplitude, PostHog, and Mixpanel are excellent at their core job: understanding user behavior in your product. The gap is the join to business outcomes — and the vendors' own efforts to close it confirm that a feature addition can't solve what is fundamentally a data-architecture problem.
Step 1: Start from the revenue questions, not the usage data
The oldest useful idea in measurement — the Goal-Question-Metric approach, from NASA-era software engineering research — says never start from available data. Start from the questions someone is actually going to ask, and let those dictate the metrics.
For a product leader at a startup, the questions are blessedly predictable:
| The question you'll face | The decision behind it | The metric that answers it |
|---|---|---|
| "Which features drive retention and expansion?" | Roadmap investment | Feature adoption rate × NRR by segment |
| "What usage patterns predict churn?" | CS and product intervention | Usage-to-churn correlation by cohort |
| "Where should the roadmap invest next?" | Resource allocation | Feature ROI (development cost vs. revenue impact) |
| "Are new features earning their development cost?" | Build vs. cut decisions | Feature adoption × retention lift |
| "Which segments use the product differently — and does it matter?" | Pricing, packaging, GTM | Usage patterns by plan, segment, account tier |
Five questions. If your analytics can answer these five — cut by the segments that matter — you're ahead of nearly every product team at your stage. Everything else is optional until it isn't.
Here's where AI changes the starting point. Instead of guessing which metrics to build, ask these questions directly against your joined data. In Definite, Fi writes the SQL, surfaces the relevant dimensions, and shows which cuts produce signal — so you discover what matters from the data, instead of hypothesizing a metric and hoping it connects.
Step 2: Decompose into a revenue-anchored metric tree
DuPont was decomposing return on equity into a tree of drivers a century ago. The product version is the same move: pick the number that connects product to the business — for most SaaS startups, that's net revenue retention (NRR) or active-account expansion — and decompose it into the drivers you can act on. The stakes are concrete: McKinsey's analysis of 100+ B2B SaaS companies found that top-quartile NRR performers trade at a median 24× EV/Revenue, versus 5× for the bottom quartile. Expansion happens inside the product — which makes NRR the metric that connects product decisions to enterprise value.
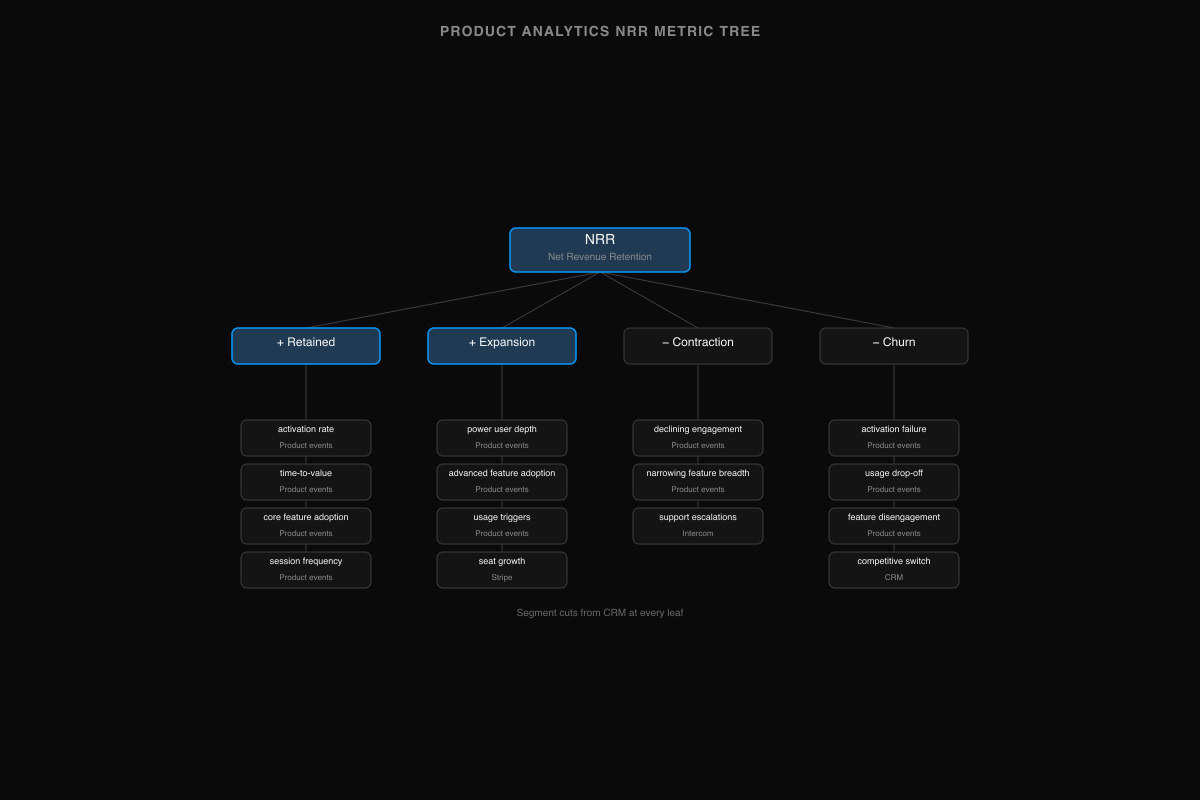
NRR decomposes into retained revenue plus expansion minus contraction minus churn. Each of those decomposes into product drivers:
- Retention ← activation rate, time-to-value, core feature adoption, session frequency
- Expansion ← power user depth, advanced feature adoption, usage-based triggers, seat growth
- Contraction ← declining engagement, narrowing feature breadth, support escalations
- Churn ← activation failure, usage drop-off, feature disengagement, competitive switch signals
Cut each driver by segment (plan, cohort, account size, geography) and you have a complete map from product behavior to business outcome. Every metric in the tree has a reason to exist — if it doesn't connect to revenue, you don't need it yet.
The tree does a second job: it tells you which source systems each branch depends on. Activation rate comes from product events. NRR comes from Stripe. Segment comes from the CRM. The tree makes the cross-system dependency visible before you start building anything.
With AI tooling, you can scaffold the metric model from this tree directly — describe the tree in plain language and let Fi generate the governed definitions for each metric, so formulas are locked before you write a single dashboard.
Step 3: Write the metric dictionary — definitions with dimensions
This is the artifact most product teams never create, and it's the one that makes everything downstream — including AI — trustworthy. One page. Each metric: a definition, a formula, the dimensions it must be cut by, the system it comes from, and a single owner.
Dimensions are not decoration. "Feature adoption is 40%" is a vanity number; "Feature adoption is 60% for enterprise accounts and 22% for self-serve" is a roadmap decision. Metrics without their segments are trivia.
The starter dictionary for a SaaS product team:
| Metric | Definition | Formula | Cut by | Source | Owner |
|---|---|---|---|---|---|
| Feature adoption rate | % of active accounts using a feature in a period | Users of feature / active users in period | Plan, segment, cohort | Product analytics | PM |
| Activation rate | % of new signups reaching the "aha moment" | Activated users / new signups | Channel, plan, cohort | Product analytics + CRM | Growth PM |
| Time-to-value | Days from signup to first meaningful action | Median days to activation event | Plan, segment | Product analytics | Growth PM |
| DAU/WAU ratio | Stickiness — how often actives return | Daily actives / weekly actives | Segment, plan | Product analytics | PM |
| Retention (7d/30d/90d) | % of cohort still active after N days | Active in period / cohort start | Cohort, plan, segment | Product analytics | PM |
| Feature ROI | Revenue impact per feature | Expansion MRR from feature-active accounts vs. feature-inactive | Feature, segment | Product analytics + Stripe | PM + Finance |
| NRR by segment | Revenue kept + grown from existing accounts | (Start ARR + expansion − contraction − churn) ÷ start ARR | Segment, plan, cohort | Stripe + CRM | Finance + Product |
Steal this table. Change the dimensions to match how your product actually segments. The point isn't these seven metrics — it's that each one is written down once, and every report, dashboard, and AI answer derives from the same definition. When two numbers disagree, the dictionary is what makes the disagreement resolvable.
This isn't just a Definite idea — the industry is converging on it. The Open Semantic Interchange standard, finalized in January 2026 by dbt Labs, Snowflake, and Salesforce, exists precisely because metric drift across teams and tools is a recognized, industry-wide problem.
In Definite, each dictionary row becomes a governed definition in the semantic layer — a single source of truth that every dashboard, AI answer, and API query reads from, instead of a wiki nobody updates. Fi Memory stores your business context — what "enterprise" means, which features are core vs. experimental, what your activation event is — so every query inherits the same assumptions without re-explaining them.
Step 4: Map your sources and make them agree
Now the step every guide compresses into "gather your data" — the one that's actually the whole problem.
For each branch of your metric tree, write down which system owns it, what field lets you match records across systems, and where that matching usually breaks:
| Data | System of record | Matched on | Where it breaks |
|---|---|---|---|
| Feature usage, sessions, events | Amplitude / PostHog / Mixpanel | user_id or anonymous_id — the key has to be created | Product user ≠ billing customer; anonymous sessions pre-signup |
| Event stream, identity | Segment | user_id synced across tools | Identity resolution only as good as your Segment setup |
| Subscriptions, MRR, plan | Stripe | email or external_id | Stripe customer ≠ CRM account; team accounts with multiple billing entities |
| Accounts, segments, owners | CRM (HubSpot / Salesforce / Attio) | domain or account_id | Free-text company names; agencies with shared domains |
| Support tickets, sentiment | Intercom / Zendesk | email or conversation user | Support user ≠ product user when admins file tickets |
| Feature flags, account config | Product database (Postgres / MySQL) | account_id | App's internal ID ≠ anyone else's ID |
This is the table to keep next to your planning docs.
The traditional fix is a data project: a warehouse, ingestion pipelines, identity resolution logic, transformation jobs. A strong engineer can assemble the tooling in a few weeks; consultant-led builds often take months. But the calendar isn't the real cost — ownership is. Someone has to maintain the pipelines, the identity matching, and the metric models forever, and that's a $130–170k/year analytics hire you weren't planning. Carta data shows the average seed-stage startup has 5.3 employees and Series A averages 15.6 — a dedicated data person is structurally unlikely at either stage. The product leader is the analyst.
This is the step where AI has genuinely changed the answer. In Definite, Fi analyzes ingested data and discovers join paths — the shared fields (typically emails or account IDs) that let you match a product user to a billing customer to a CRM account. The industry calls this entity resolution, and it used to be a manual data-engineering exercise. Now it's AI-assisted discovery with a verifiable result. You connect Amplitude, Stripe, and your CRM with pre-built connectors; product databases come in via replication. The joins land as inspectable SQL, so you can audit how user_id 4782 became part of account Acme before a number reaches a roadmap review.
The division of labor matters: AI resolves the identities and maintains the joins. You decide what the metrics mean.
Step 5: Build the dashboard last — distribute answers where decisions happen
With definitions and joins in place, the dashboard is genuinely the easy part. One page per board question from Step 1 is plenty. See what the views look like when built: Product Analytics Dashboard, Amplitude Product Analytics, PostHog Product Analytics. For the cross-system outcome views — usage joined to revenue — see the Retention and Churn dashboards.
Two upgrades worth making at this stage:
- Answers where decisions happen. A weekly feature-adoption digest in Slack beats a dashboard nobody opens. Alerts when a usage pattern shifts — adoption dropping for enterprise accounts, activation rate falling for a new cohort — beat discovering it during roadmap prep.
- Ad-hoc questions answered from governed definitions. When the CEO asks the next question — "what's retention excluding that one enterprise logo?" or "which features do accounts use before they expand?" — you want to ask it in plain English and trust the answer because it's computed from the dictionary, not improvised. That's what Fi does in Definite: it writes the SQL against your governed definitions and shows the work.
In Definite, you can ask Fi to build the dashboard from a prompt — "show me feature adoption by segment with retention impact" — and it generates the layout, writes the queries against your Cube definitions, and you edit from there. Schedule autonomous agents to surface weekly product-revenue summaries in Slack, or set alerts when usage-to-revenue correlations shift.
Step 6: Keep the numbers defensible
Product metrics have a credibility problem. Every team has seen a "north star" metric that went up while revenue went flat — because the metric was never connected to the business. Three habits fix this:
- One owner per metric. The dictionary already names them. Disagreements route to the owner instead of dying in a Slack thread.
- A tiered review cadence. Weekly: leading indicators — activation rate, feature adoption, stickiness. These move fast and surface problems early. Monthly: lagging indicators — NRR by segment, feature ROI, retention curves. These need a full month of data to be meaningful. Quarterly: roadmap evidence — cumulative patterns that justify investment decisions. Match the cadence to the signal's natural frequency; reviewing NRR weekly is noise.
- Reconcile against what you've already reported. When you stand the new system up, run it against prior quarters. Some metrics will shift — usually because the spreadsheet was quietly wrong or because the definition wasn't consistent. That's a footnote in the next roadmap review, not a confession. Doing this before a planning cycle is vastly cheaper than discovering it mid-roadmap.
Automate the plumbing: scheduled pipelines refresh the data, autonomous agents surface anomalies, and Fi Memory carries context between reviews — so the AI remembers what you discussed last month and flags when a pattern you were watching has changed.
The test for every number that enters a roadmap discussion: if someone challenges it, can you trace it to the events and revenue records it came from? With written definitions over joined data, the answer is finally yes.
AI product analytics: the startup version is a different problem
Search "AI product analytics" and everything you'll find assumes a product analytics team — dedicated analysts running experiments, data scientists building predictive models. Useful, and irrelevant to you. The startup version of the problem is the inverse: there is no analytics team. The product leader is the analyst.
The question isn't "will AI replace our product analysts" — it's "can AI be the analyst we never hired?"
The answer is yes, with one condition the enterprise content never spells out: AI is only as defensible as the definitions underneath it. Pointed at ungoverned product events across three disconnected systems, AI confidently produces wrong numbers — it just produces them faster. Pointed at a metric dictionary over joined data, it does the work of the analyst you skipped: the entity resolution, the dimension cuts, the first draft of every roadmap answer. The system in this post is, concretely, how a startup makes AI product analytics trustworthy.
Doing this with Definite
The honest pitch, briefly. Definite is the system above, packaged. You get 500+ connectors — Amplitude, PostHog, Mixpanel, Segment, Stripe, Intercom, plus product databases via replication — with storage and modeling included. Your metric dictionary becomes governed definitions in a semantic layer. Fi is an AI analyst that answers questions from those definitions with inspectable SQL underneath, discovers join paths across your systems, and builds dashboards from prompts. Setup is connect-and-go; your first cross-system product-revenue numbers arrive the same afternoon.
Pricing is one flat platform fee — $250/month, unlimited users, with AI usage metered past an included allowance (pricing). Flat matters here because per-seat pricing is how analytics tools quietly become single-player; with one price, the PM, the CEO, and the growth lead are all looking at the same governed numbers.
If you'd rather assemble it yourself: a warehouse, an ingestion tool, a modeling layer, a BI tool, and the time to make them agree. The system in this post works either way. One of them is a weekend.
→ More on the product setup specifically: Definite for product teams.
This post is part of a series on startup analytics by function. The same system — decisions, metric tree, dictionary, sources, build, cadence — applies with different metrics and sources for finance, marketing, RevOps, executive dashboards, and customer success. If you're using PostHog as your product analytics tool, see also PostHog as a data warehouse for how the infrastructure side works.
FAQ
Can't I just do this in Amplitude / Mixpanel / PostHog? They're excellent at what they do — behavior tracking, funnels, retention curves within your product. The gap is the cross-system join: they can't see your billing data in Stripe, your account segments in the CRM, or your support patterns in Intercom. Definite sits beside your product analytics tool, consuming its events and joining them to the rest of the business. Augmentation, not replacement.
How do I connect product analytics data to revenue? Step 4: entity resolution. Match product user_ids to billing customers and CRM accounts — typically via emails or shared IDs. Once the entities are resolved, you can ask "did accounts that adopted feature X expand at a higher rate than those that didn't?" The join is the mechanism; everything downstream is a query.
What metrics show which features drive retention? Feature adoption rate cut by retention cohort (Step 3). You need the cross-system join (Step 4) to see which features the accounts that renewed were using vs. the accounts that churned. Without the join, you have usage and retention in two different systems with no way to connect them.
Do I need a data engineer to set this up? Not at startup scale. With modern tooling — pre-built connectors, AI-assisted entity resolution, a semantic layer for definitions — the setup is connect-and-go. The analytics-engineer hire is what you need when you want to own and extend the infrastructure; it's a staffing choice, not a maturity milestone.
How many product events can this handle? Millions of events — startup and growth-stage scale is well within range. The bottleneck at startup scale is never volume; it's the identity resolution and metric governance that make those events meaningful.
What's the difference between product analytics and business analytics? Product analytics answers "what users do inside the product." Business analytics answers "what that behavior means for the business." This guide connects them — so "40% feature adoption" becomes something like "40% feature adoption, and accounts that adopt expand at a higher rate than those that don't." The number stops being trivia and starts being a roadmap input.
Your product analytics tool will keep getting better at tracking behavior — that's its job. The fix was never a better engagement chart. Define the metrics once, join usage to revenue at the account grain, let AI carry the entity resolution and governance, and make roadmap decisions from numbers you can trace. Try Definite free or see how it fits product teams specifically.