SaaS Marketing Analytics: How to Connect Ad Spend to Revenue Without a Data Team

Sooner or later the CEO asks a question that shouldn't be hard: "What's our blended CAC by channel?" You open HubSpot — 28 new customers last month. Google Ads says it drove 40 conversions. Meta says 35. You pull up Stripe and count 22 paying customers. Four systems, four numbers, no shared definition of "customer," and a board meeting in three days.
The instinct is to go shopping for an attribution tool. Resist it. Marketing analytics doesn't fail at the attribution model or the dashboard — it fails where your ad platforms, your CRM, and your billing system are supposed to agree on who the customer is, and don't. Once your metrics are defined in one place over data that actually connects, the dashboard is an afternoon of work. This guide is the sequence: what to decide first, what to set up second, and what you can skip entirely at your stage.
One disclosure before we start: Definite is an all-in-one analytics platform, so we'll show each step working in Definite as the running example. The system itself is tool-agnostic — you could execute it with a warehouse and a hired analyst. The argument of this post is that you shouldn't have to.
The system in brief:
- Start from the five decisions your marketing team actually makes each week — not from the metrics you happen to have.
- Build a funnel that tracks conversion rates at each stage with attribution back to source, so every metric connects to a decision you need to make.
- Write a metric dictionary: each metric defined once, with a formula, the breakdowns that matter (by channel, by cohort, by campaign), a source system, and an owner. A metric without its breakdowns is a vanity number.
- Map every metric to its source systems and fix the places where they disagree — this is where marketing analytics actually breaks, and where AI now does the heavy lifting.
- Build the dashboard last. Distribute answers where people work (Slack, email, the weekly standup).
- Keep numbers calibrated: one owner per metric, a monthly check, and reconciliation against what you've already reported.
Total time with modern tooling: an afternoon to stand up, then the first monthly calibration is where the numbers earn trust. No data engineer, no warehouse project.
Why every platform claims the conversion
Before fixing anything, it helps to know why Google Ads, Meta, HubSpot, and Stripe each show a different number of conversions. It isn't sloppiness — each system is answering a different question from different data:
- Self-attribution. Every ad platform counts its own influence. Google counts the click. Meta counts the view or the click. HubSpot counts the form fill. An ad platform that doesn't claim the conversion loses budget — the incentive structure guarantees overcounting. A D2C brand we worked with discovered their Meta-reported CAC looked like a profitable first sale — but when they blended it with their actual Stripe revenue by cohort, the real number was far worse. The platform wasn't lying; it was counting what it could see, which excluded everything it couldn't. Another marketing leader told us the only attribution method that actually matched reality was asking customers directly — "how did you hear about us?" — and the answer was almost always different from what the analytics showed.
- No shared customer ID. Google Ads knows a click ID. HubSpot knows an email address. Stripe knows a customer object. With no shared identifier, answering "which channel drove this customer?" requires a human to decide that ad click #ABC123, lead jane@acme.com, and Stripe customer cus_XYZ are the same person — every single month.
- Different grain. Google counts clicks. HubSpot counts leads. Stripe counts payments. These are different units — summing across them without alignment is how "40 conversions" and "22 paying customers" both look right and neither is useful.
- Timing. The click happened Tuesday. The MQL was scored Thursday. The deal closed three weeks later. Which month gets credit for the conversion? Each system answers differently, and none of them are wrong — they're just measuring different things.
Step 1: Start from the decisions, not the metrics
A useful framing from measurement theory — the Goal-Question-Metric approach — says you never start with available data. You start with the decisions someone actually needs to make, and let those dictate the metrics.
For a startup marketing team, the decisions are predictably few:
| The decision | The question behind it | The metric that answers it |
|---|---|---|
| Scale or pause a channel | "What's our blended CAC by channel — and is it trending up or down?" | Channel CAC, blended CAC, CAC trend |
| Raise or cut total budget | "What's our overall ROAS and how does it compare to target?" | Blended ROAS, spend vs. pipeline |
| Iterate on campaigns | "Which campaigns are converting to pipeline, not just clicks?" | Campaign → MQL → SQL conversion rate |
| Assess funnel health | "Where are we losing people?" | Stage conversion rates, time-in-stage |
| Report to the board | "What does growth cost and when does it pay back?" | CAC payback period, LTV:CAC ratio |
Five decisions. If your analytics answer these five reliably, cut by the dimensions that matter, you're ahead of most marketing teams at your stage. Everything else is optional until it isn't.
Step 2: Build a funnel with attribution back to source
Finance teams decompose a north-star metric into a tree of drivers (that's how the finance version of this guide works — runway decomposes into cash and net burn, and each branch traces to a source system). Marketing metrics are structured differently: they're journey-shaped, not tree-shaped.
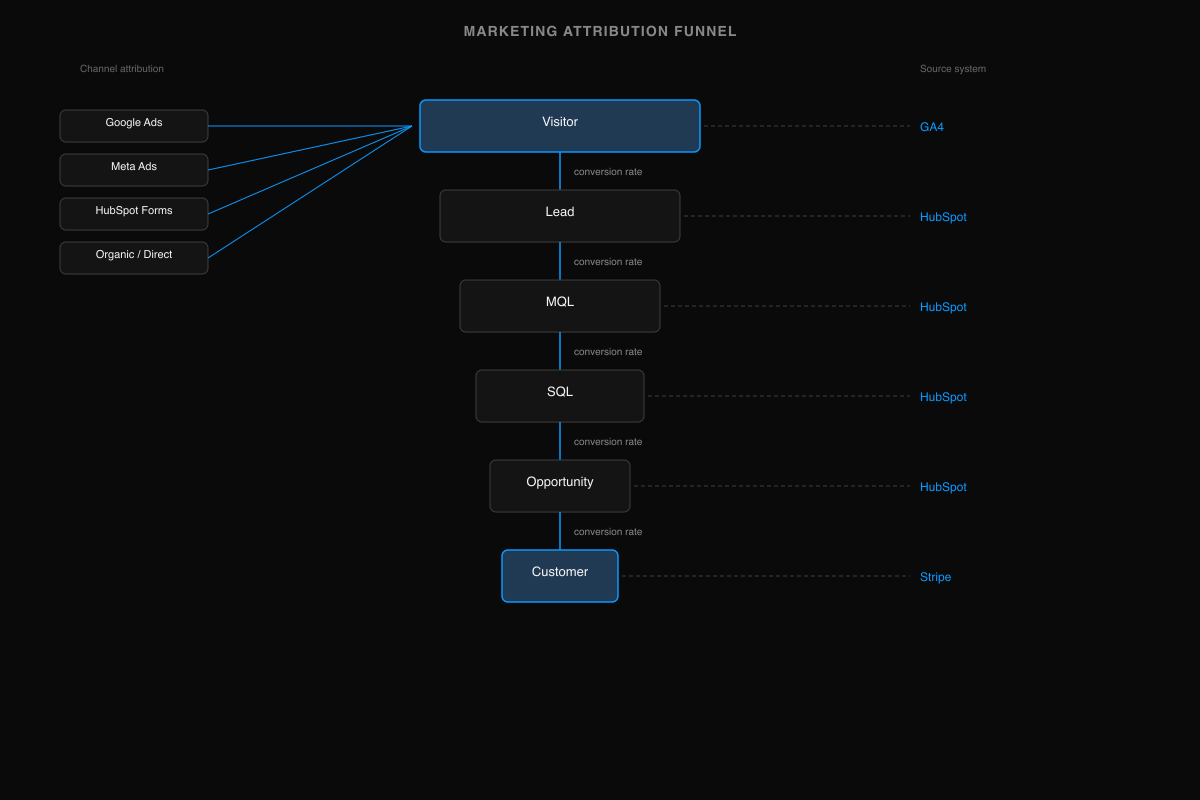
The shape is a funnel with conversion rates at each stage:
Visitor → Lead → MQL → SQL → Opportunity → Customer
At each transition, two things matter: the conversion rate (what percentage moves forward?) and the channel attribution (which source gets credit?). The funnel gives every metric a reason to exist — if a metric doesn't map to a stage transition, you don't need it yet.
The attribution model choice — last-touch, first-touch, multi-touch, data-driven — matters less than you think. Attribution on unjoined data is theology: each platform preaches its own gospel. Attribution on joined data is arithmetic. Pick a model, apply it consistently, and revisit quarterly. An agency founder we spoke with — running attribution for twenty-plus SMB clients — had been cycling between multi-touch and last-touch models, trying to create a credible ROAS story without overcomplicating it. The insight: the model wasn't the problem. The problem was that none of his tools could connect ad spend to actual revenue in the first place.
This funnel structure draws on Kaushik's measurement model and pirate metrics — neither is new; the contribution is applying them over joined data instead of single-platform dashboards.
Step 3: Write the metric dictionary — definitions with dimensions
This is the artifact most marketing teams never create, and it's the one that makes everything downstream — including AI — trustworthy. One page. Each metric: a definition, a formula, the dimensions it must be cut by, the system it comes from, and a single owner.
Dimensions are not decoration. "CAC is $180" is a number with no steering value; "CAC is $95 from organic search, $220 from paid social, and $340 from LinkedIn — and LinkedIn's trending up" is a decision. Metrics without their dimensions are trivia.
The starter dictionary for a SaaS marketing team:
| Metric | Definition | Formula | Cut by | Source | Owner |
|---|---|---|---|---|---|
| Blended CAC | Cost to acquire one customer, all channels | Total marketing spend ÷ new customers | Channel, cohort, segment | Ad platforms + Stripe | Marketing lead |
| Channel CAC | Cost per customer from one source | Channel spend ÷ customers attributed to that channel | Campaign, time period | Per-platform + Stripe | Marketing lead |
| ROAS | Revenue return on ad spend | Revenue attributed ÷ ad spend | Channel, campaign, cohort | Stripe + ad platforms | Marketing lead |
| MQL → SQL rate | Lead quality signal | SQLs ÷ MQLs | Channel, campaign, content | CRM (HubSpot / Salesforce) | Marketing + sales |
| Pipeline velocity | Speed from lead to close (requires clean deal stages in your CRM) | Σ (deal value × win rate) ÷ avg days in pipeline | Segment, channel | CRM | Sales + marketing |
| LTV:CAC ratio | Payback efficiency | Lifetime value ÷ blended CAC | Segment, plan, channel | Stripe + CRM | Finance + marketing |
| CAC payback | Months to recover acquisition cost | CAC ÷ (monthly ARPA × gross margin) | Channel, segment | Stripe + CRM | Finance + marketing |
| Funnel conversion | Stage-to-stage health | Stage N+1 ÷ Stage N | Stage pair, channel, period | CRM + GA4 | Marketing lead |
Steal this table. Change the dimensions to match how your business actually segments. The point is not these eight metrics — it's that each one is written down once, and every report, dashboard, and AI answer derives from the same definition. When two numbers disagree later, the dictionary is what makes the disagreement resolvable.
Step 4: Map your sources and make them agree
Now the step every guide compresses into "gather your data" — the one that's actually the whole problem.
For each metric in your dictionary, write down which system owns the underlying data, what field lets you match records across systems (the field both systems share), and where that matching usually breaks:
| Data | System of record | Matched on | Where it breaks |
|---|---|---|---|
| Ad spend, impressions, clicks | Google Ads, Meta Ads, LinkedIn Ads | click ID, UTM params | Each platform uses its own ID; UTMs get stripped, rewritten, or dropped by mobile browsers |
| Leads, pipeline, deal stages | HubSpot / Salesforce | email or synced ID | Duplicate contacts; company ≠ contact; free-text company names |
| Website sessions, conversions | GA4 / Segment | client ID, session stitching | Cookie consent gaps; GA4's data-driven attribution is opaque and only covers its own data |
| Revenue, payments | Stripe | customer email or synced ID | Stripe customer ≠ CRM contact; subscription vs. one-time charges mixed together |
| Product usage | App DB / events | account_id | The app's ID isn't anyone else's ID |
This is the table to keep next to your monthly check. It's where marketing analytics actually breaks.
The traditional fix is a data project: a warehouse, ingestion pipelines, transformation jobs. A capable engineer can assemble the tooling in a few weeks; consultant-led builds often take months. But the calendar isn't the real cost — ownership is. Someone has to maintain the pipelines, the models, and the identity matching forever, and that someone is a $130–190K/year analytics hire you weren't planning. (Run your own numbers: data stack cost calculator.) One marketing ops lead we talked to needed unified reporting across Salesforce and HubSpot with zero analytics staff. When asked whether anyone on the team writes SQL: "no — we don't have anyone like that." She was right to be frustrated; that shouldn't be a prerequisite.
This is the step where AI has genuinely changed the answer. The plumbing — syncing the ad platforms, matching customer identities across systems, classifying traffic sources, keeping it all refreshed — is exactly the work AI handles well, because it's pattern matching with a verifiable result. Concretely: AI takes the fields you mapped in the table above — email addresses, click IDs, synced CRM identifiers — matches them across systems, and surfaces the matches for you to verify before any number reaches a report. In Definite, connecting HubSpot, Google Ads, Facebook Ads, and Stripe takes a few minutes each; your metric dictionary from Step 3 becomes the rules the AI is required to follow.
The division of labor matters more than the tool: AI reconciles the systems. You sign the numbers.
Everything the AI builds lands as inspectable tables — including which customers it matched and why — so you can audit the logic before a number reaches a deck. The SQL underneath is there if someone more technical wants to check. Any tool — including ours — that offers instant answers without showing the definitions and joins underneath is asking you to put an unauditable number in front of your board.
Step 5: Build the dashboard last — distribute answers where people work
With definitions and joins in place, the dashboard genuinely is the easy part: one view per decision is plenty. Attribution gallery templates don't fix any of this — a chart of numbers nobody trusts is just faster mistrust.
Two upgrades worth making at this stage:
- Answers where people work. A weekly marketing performance digest in Slack beats a dashboard nobody opens. Alerts when CAC spikes above threshold or funnel conversion drops below target beat discovering it during board prep.
- Ad-hoc questions answered from your definitions. When the CEO asks "what's our ROAS on LinkedIn this quarter excluding that one big enterprise deal?" you want to ask it in plain English and trust the answer because it's computed from the dictionary, not improvised. That's what Fi, Definite's AI analyst, does.
Step 6: Keep the numbers calibrated
Marketing-grade isn't a precision standard, it's a trust standard. Three habits:
- One owner per metric. The dictionary already names them. When ROAS is computed differently in the board deck vs. the Google Ads console, the owner decides — and explains the difference to the room.
- Monthly calibration. Once a month, ad spend per your joined system reconciles against actual invoices from each ad platform. This catches the drift that monthly exports, billing delays, and currency conversions introduce.
- Cross-check the narrative. When you switch from "whatever HubSpot says" to cross-system attribution, some channels will look better, some worse. That's a strategy conversation — "LinkedIn costs more but produces bigger deals" — not a data error. Have the conversation explicitly; don't let it happen as a surprise in the board deck.
AI marketing analytics: the startup version is a different problem
If you search "AI marketing analytics," everything you'll find is written for enterprises — marketing mix modeling, brand lift studies, Bayesian attribution engines, custom propensity models. Useful, and irrelevant to you. The startup version of the problem is the inverse: there is no data team to configure the models. The question isn't "will AI replace our analysts" — it's "can AI be the analyst we never hired?"
The answer is yes, with one condition the enterprise content never has to spell out: AI is only as trustworthy as the definitions underneath it. Pointed at unjoined platform exports, AI confidently double-counts every conversion — it sees what each platform sees and inherits the same overcounting. Pointed at your metric dictionary over joined data, it does the work of the analyst you skipped: campaign comparisons, funnel diagnostics, spend optimization signals, and the first draft of every board answer. The system in this post is, concretely, how a startup makes AI marketing analytics trustworthy.
Doing this with Definite
The honest pitch, briefly. Definite is the system above, packaged — one platform replaces the warehouse, ingestion tool, transformation layer, BI tool, and the person who makes them agree. Every source from Steps 1–4 is covered: HubSpot, Google Ads, Facebook Ads, LinkedIn Ads, Stripe, GA4, and hundreds more. Your metric dictionary becomes the definitions the AI must follow, and Fi — Definite's AI analyst — answers questions from those definitions with inspectable logic underneath. Start free with the full platform — no budget approval required. When you're ready, pricing is one flat fee: $250/month, unlimited users (pricing). Flat matters because per-seat pricing is how analytics tools quietly become single-player.
If you'd rather assemble it yourself: a warehouse, an ingestion tool, a modeling layer, a BI tool, and the time to make them agree. The system in this post works either way. One of them is an afternoon.
→ More on the marketing setup specifically: Definite for marketing teams.
FAQ
How do I calculate blended CAC across Google Ads, Facebook, and organic? Step 3, then Step 4: define blended CAC once (total marketing spend ÷ new customers), then make the ad platforms and Stripe agree on who the customer is. The formula is simple; the join is the hard part. Channel CAC follows the same pattern — same formula, filtered by source.
What marketing metrics should I report to the board? The Step 1 table: CAC payback period, LTV:CAC ratio, blended ROAS, pipeline velocity, and funnel conversion rate by stage. Five metrics, cut by the dimensions the board actually asks about (by channel, by segment, by quarter). That's enough until someone asks a question these can't answer.
Should I use last-touch or multi-touch attribution? It matters less than having joined data. Attribution on unjoined platform exports is theology — each platform preaches its own gospel. Pick one model (last-touch is the simplest honest starting point), apply it consistently from joined data, and revisit quarterly. The model only matters once the data is connected.
How do I connect HubSpot data to Stripe revenue? Step 4: match on customer email or a synced CRM ID. Email is usually the match field — but duplicates, typos, and shared company domains break it. This is identity matching, and it's either manual reconciliation or the kind of pattern matching AI handles well.
What's a good LTV:CAC ratio for a Series A SaaS company? 3:1 or better — a customer's lifetime value should be at least three times what it cost to acquire them. But the ratio is only meaningful when both numbers come from the same definition over the same data. LTV from one system and CAC from another is comparing numbers that were never meant to be compared.
How do I measure marketing ROI without a data analyst? This guide. Steps 1–4 get your data connected and your metrics defined; the AI carries the joins from there. The system works without SQL or a warehouse project.
Growth will keep getting more expensive — that's the market. The fix was never a better dashboard or a fancier attribution model. Define the metrics once, connect the systems they come from, let AI carry the joins, and sign numbers you can trace from board deck to ad platform. Try Definite free or see how it fits marketing teams specifically.