Startup Financial Reporting: Make Stripe, QuickBooks, and Your CRM Agree

Sooner or later a board member asks for a number you can't produce. Net revenue retention by customer segment, monthly, going back eighteen months — and you sit there knowing that your revenue lives in Stripe, your contracts live in the CRM, your general ledger lives in QuickBooks, and the three of them have never once agreed with each other.
The instinct is to go shopping for a dashboard. Resist it. Startup financial reporting doesn't fail at the dashboard — it fails where Stripe, QuickBooks, and your CRM are supposed to agree and don't. Once your metrics are defined in one place over numbers that actually tie out, the dashboard is an afternoon of work. This guide is the build order: what to decide first, what to set up second, and what you can skip entirely at your size.
One disclosure before we start: Definite is an all-in-one data platform, so we'll show each step working in Definite as the running example. The system itself is tool-agnostic — you could execute it with a warehouse and a hired analyst. The argument of this post is that you shouldn't have to.
The system in brief:
- Start from the five questions your board actually asks — runway, growth, retention quality, margin, and efficiency — not from the data you happen to have.
- Decompose your north-star number into a metric tree so every metric has a reason to exist.
- Write a metric dictionary: each metric defined once, with a formula, the dimensions it must be cut by, a source system, and an owner. A metric without its dimensions is a vanity number.
- Map every metric back to source systems and fix the places where they disagree — this is where startup reporting actually breaks, and where AI now does the heavy lifting.
- Build the dashboard last. Distribute answers where people work (Slack, email, the board deck).
- Keep numbers defensible: one owner per metric, a monthly tie-out cadence, and reconciliation against what you've already reported.
Total time with modern tooling: a weekend to stand up — then the first monthly tie-out is where the numbers earn parity with what you've already reported. No data engineer, no warehouse project.
Why your numbers don't agree
Before fixing anything, it helps to know why Stripe, QuickBooks, and your CRM produce three different revenue numbers. It isn't sloppiness — and it isn't just the famous mechanical stuff, either. Yes, Stripe deposits net of fees, batches fifty sales into one payout, and books refunds on a different day than the sale. That's why Stripe ships a dedicated payout-reconciliation report and an entire ecosystem of reconciliation tools exists. But install all of them and four structural mismatches remain, because the systems are answering different questions:
- Timing. Stripe records money when it's collected. QuickBooks (done properly) recognizes revenue when it's earned. An annual contract billed in January is one Stripe event and twelve QuickBooks entries. Neither is wrong; they tie out only if something maps invoices to recognition schedules.
- Classification. Stripe doesn't know which charges are recurring and which are one-time unless you've told it. The fastest way to overstate MRR is to let implementation fees and one-off invoices leak into it — it's the first reason metric tools' numbers differ from Stripe's.
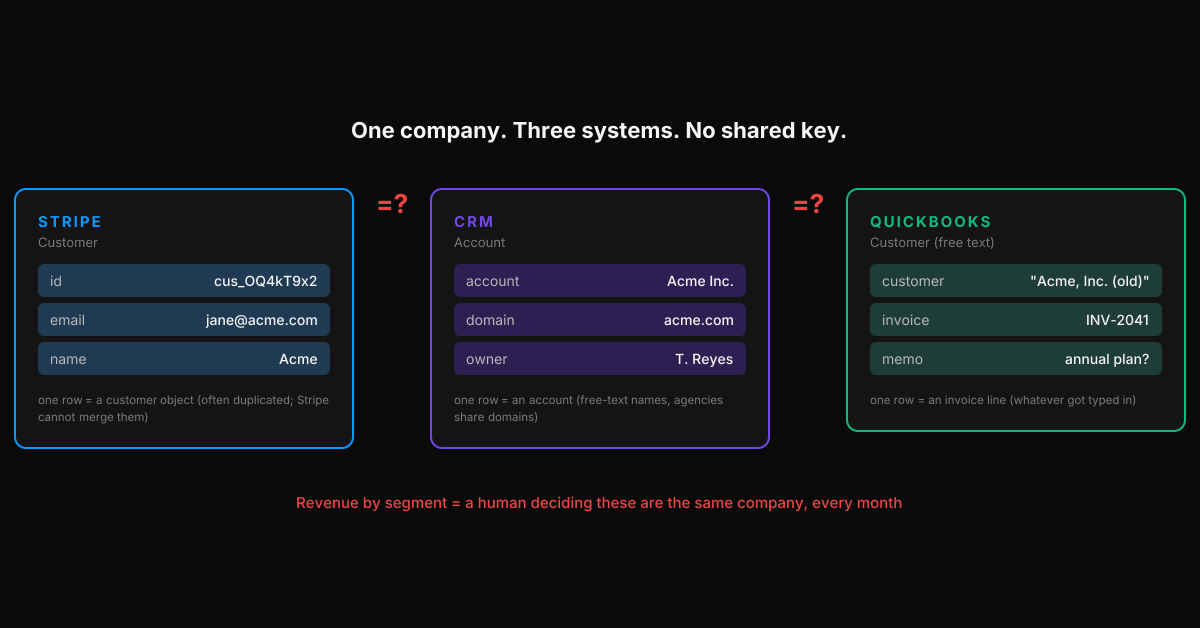
- Identity. Your CRM knows accounts. Stripe knows customers. QuickBooks knows... whatever got typed into the customer field. With no shared identifier, "revenue by segment" requires a human to decide that Acme Inc., acme.com, and Acme, Inc. (old) are the same company — every single month.
- Grain. Each system's rows represent different things — a charge, an invoice line, an opportunity. ("Grain" just means: what one row stands for.) Summing across grains without aligning them is how the same quarter shows three different totals.
One finance lead we spoke with hit the purest form of this problem: the board asked for a churn figure at the Q1 meeting, and the reports her systems exported had no shared identifier — there was literally no way to tie the numbers together without rebuilding them by hand. She runs finance, not data engineering. Nothing about that situation was her fault. It was a reconciliation problem wearing a reporting costume.
Step 1: Start from the board's questions, not the data
The oldest useful idea in measurement — the Goal-Question-Metric approach, which came out of NASA-era software engineering research — says you never start with available data. You start with the questions someone is actually going to ask, and let those dictate the metrics.
For a seed-to-Series-B startup, the board's questions are blessedly predictable:
| The question they'll ask | The decision behind it | The metric that answers it |
|---|---|---|
| "How long can we operate?" | Raise timing, spend posture | Cash runway, net burn |
| "How fast are we growing — and what does a dollar of growth cost?" | GTM investment | ARR growth rate; burn multiple (net burn ÷ net new ARR) |
| "Is the revenue we keep healthy?" | Product and CS priorities | Net revenue retention, by segment |
| "Does the business model work?" | Pricing, infra spend | Gross margin, trended |
| "When does the GTM math pay back?" | Hiring plan | CAC payback, by channel |
Five questions. If your reporting answers these five reliably, cut by the dimensions that matter, you are ahead of most startups at your stage. Everything else is optional until it isn't.
Step 2: Decompose into a metric tree — so every metric has a reason to exist
Finance invented this move: DuPont was decomposing return on equity into a tree of drivers a century ago. The modern version goes by metric tree or driver tree, and the mechanics are the same. Pick the number the board cares most about — for most SaaS startups it's runway or net burn — and decompose it into the drivers you can actually act on. Runway decomposes into cash and net burn; net burn into revenue collected and operating spend; revenue into new, expansion, contraction, and churned MRR; each of those cuts by segment and plan.
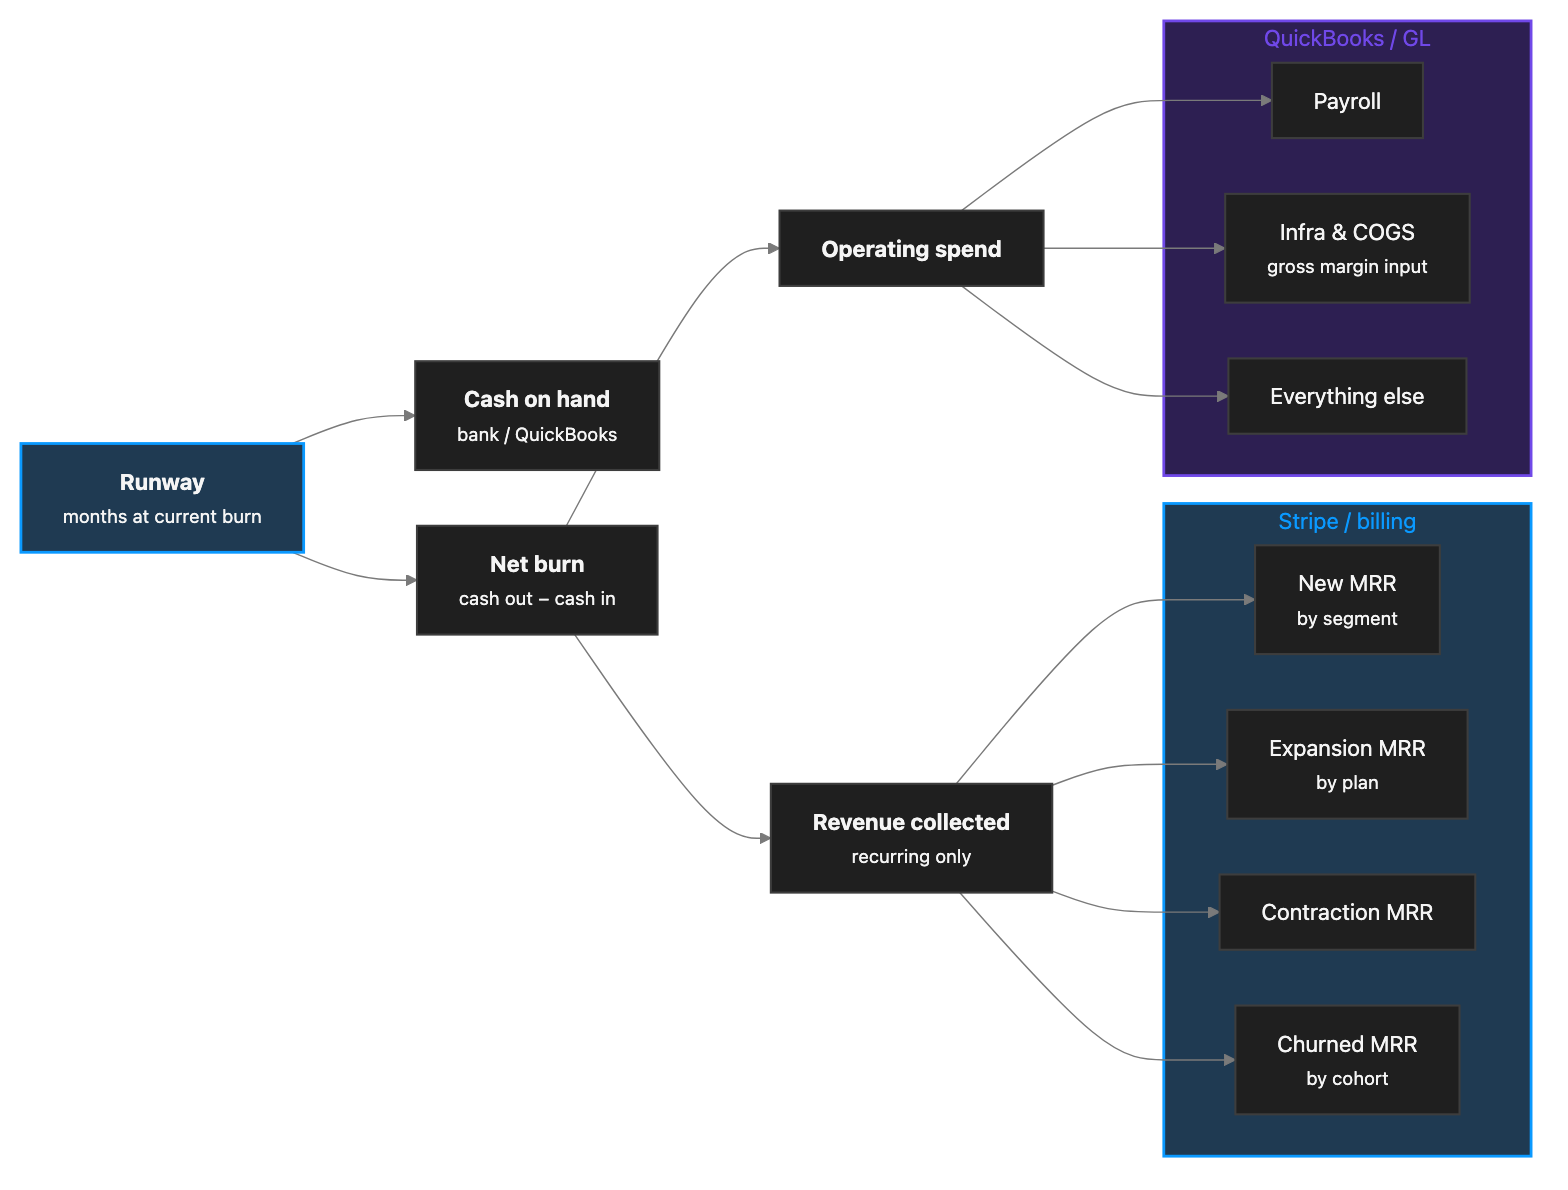
The tree does two jobs. It gives every metric a reason to exist — if a metric doesn't connect to the tree, you don't need it yet (this is the spirit of Lean Analytics' "one metric that matters"). And it tells you in advance which source systems each branch depends on, which is exactly what you need for Step 4.
Step 3: Write the metric dictionary — definitions with dimensions
This is the artifact most startups never create, and it's the one that makes everything downstream — including AI — trustworthy. One page. Each metric: a definition, a formula, the dimensions it must be cut by, the system it comes from, and a single owner.
Dimensions are not decoration. "NRR is 104%" is a vanity number; "NRR is 124% for mid-market and 81% for self-serve" is a decision. Metrics without their segments are trivia.
The starter dictionary for a SaaS startup:
| Metric | Definition | Formula | Cut by | Source | Owner |
|---|---|---|---|---|---|
| MRR | Recurring revenue, normalized monthly; excludes one-time charges | Σ active subscription value / month | Plan, segment, geography | Stripe / billing | CEO or finance lead |
| ARR | Annualized run rate | MRR × 12 | Segment | Stripe / billing | Finance |
| ARR growth | Pace of new scale | (ARR now − ARR prior period) ÷ ARR prior period | Segment, quarter | Stripe / billing | CEO |
| NRR | Revenue kept + grown from existing customers | (Start ARR + expansion − contraction − churn) ÷ start ARR | Segment, cohort, plan | Stripe + CRM | Finance |
| Gross margin | What's left after cost of service | (Revenue − COGS) ÷ revenue | Product line | QuickBooks | Finance |
| Net burn | Cash out minus cash in | Monthly cash delta, financing excluded | — | QuickBooks / bank | Finance |
| Runway | Months at current burn | Cash ÷ trailing-3-mo avg net burn | Scenario (current / planned spend) | QuickBooks + model | CEO |
| Burn multiple | Cost of a dollar of growth | Net burn ÷ net new ARR | Quarter | Stripe + QuickBooks | CEO |
| CAC payback | Months to recover acquisition cost | CAC ÷ (new ARPA × gross margin) | Channel, segment | CRM + QuickBooks | GTM + finance |
(One definitional honesty note: NRR has a component form, shown above, and a cohort form — this year's revenue from last year's customers ÷ what they paid last year. Both are legitimate; pick one and use it everywhere, because mixing them is how two "correct" NRRs end up in the same deck.)
Steal this table. Change the dimensions to match how your business actually segments. (Usage-priced or services revenue? Same system — different dictionary rows.) The point is not these eight metrics — it's that each one is written down once, and every report, dashboard, and AI answer derives from the same definition. When two numbers disagree later, the dictionary is what makes the disagreement resolvable.
Step 4: Map your sources and make them agree
Now the step every guide compresses into "gather your data" — the one that's actually the whole problem.
For each branch of your metric tree, write down which system owns it, what field lets you match records across systems (data people call this the join key — it's the field both systems share), and where that matching usually breaks:
| Data | System of record | Matched on | Where it breaks |
|---|---|---|---|
| Subscriptions, MRR events | Stripe | email or a synced ID — the key usually has to be created | Stripe customer ≠ CRM account; duplicate customers Stripe can't merge |
| Pipeline, segments, owners | CRM (HubSpot/Salesforce/Attio) | account domain / email | Free-text company names; agencies sharing domains |
| Expenses, COGS, GL truth | QuickBooks / Xero / NetSuite | invoice ↔ charge ↔ payout | One payout bundles dozens of charges; fees netted invisibly; multi-entity consolidation |
| Product usage (if usage-priced) | App DB / events | account_id | The app's ID ≠ anyone else's ID |
This is the table to screenshot — keep it next to your close checklist.
The traditional fix is a data project: a warehouse, pipelines, transformation jobs. A strong engineer can assemble the tooling in a few weeks; consultant-led builds often take months. But the calendar isn't the real cost — ownership is. Someone has to maintain the pipelines, the models, and the identity matching forever, and that someone is a $130–170k/year analytics hire you weren't planning, which is why most startups quietly decide the Saturday spreadsheet is fine. (Run your own numbers: data stack cost calculator.) One founder we talked to — a technical one, who could have built all of it himself — told us his weekly scorecard meant chasing numbers across five disconnected tools, and refused on principle to become his company's human join key. He was right: at startup scale, you are the missing infrastructure.
This is the step where AI has genuinely changed the answer. The plumbing — syncing the systems, matching identities across them, classifying recurring vs. one-time, keeping it all refreshed — is exactly the work AI handles well, because it's pattern matching with a verifiable result. In Definite, connecting QuickBooks, Stripe, and your CRM takes a few minutes each; QuickBooks arrives with a pre-built semantic model, and your metric dictionary from Step 3 becomes governed definitions the AI is required to use.
The division of labor matters more than the tool: AI reconciles the systems. You sign the numbers.
Everything the AI builds lands as inspectable tables and SQL — including the identity matches — so you can audit how customers were linked before a number reaches a deck. Any tool — including ours — that offers instant answers without showing the definitions and joins underneath is asking you to put an unauditable number in front of your board.
Step 5: Build the dashboard last — and distribute answers, not links
With definitions and joins in place, the dashboard genuinely is the easy part: one page per board question is plenty. Dashboard template galleries don't fix any of this — a chart of a number nobody trusts is just faster mistrust.
Two upgrades worth making at this stage:
- Answers where people work. A weekly digest of the five board metrics in Slack beats a dashboard nobody opens. Alerts when a metric crosses a threshold (burn up 15% month-over-month) beat discovering it during deck prep.
- Ad-hoc questions answered from governed definitions. When the board asks the next question — "what's NRR excluding that one big logo?" — you want to ask it in plain English and trust the answer because it's computed from the dictionary, not improvised. That's what Fi does in Definite.
One RevOps lead we worked with was prototyping dashboards during a trial, and they were clean enough that they became the company's investor dashboards the same month. That's the correct order of operations working: definitions first, then the asks — and the deck takes care of itself.
Step 6: Keep the numbers defensible
Board-grade isn't a precision standard, it's a traceability standard. Three habits:
- One owner per metric. The dictionary already names them. Disagreements route to the owner instead of dying in a thread.
- A monthly tie-out cadence. Once a month, MRR per the system reconciles against revenue per the books. Differences get explained (timing, classification), not shrugged at.
- Reconcile against your reported history. This is the step nobody tells you about. When you stand up the new system, run it against the last two or three quarters and reconcile what it produces against what you already told the board. Some numbers will shift — usually because the old spreadsheet was quietly wrong. That's a footnote in your next board deck ("we moved to system-generated metrics; historical NRR restated by 1.2 points"), not a confession. Doing this before a fundraise is vastly cheaper than having a diligence analyst find it for you. Diligence practitioners are blunt about how this works: sophisticated investors rebuild your metrics from your raw billing and bank data, and if their numbers don't match yours, trust is gone.
The test for every number that leaves your hands: if someone challenges it in the room, can you trace it to the invoices it came from? With written definitions over joined data, the answer is finally yes — even when the number was produced by AI, because the AI is reading the same dictionary you are.
AI financial reporting: the startup version is a different problem
If you search "AI financial reporting," everything you'll find is written for enterprises — close automation, audit support, compliance narratives. Useful, and irrelevant to you. The startup version of the problem is the inverse: there is no finance team to assist. The question isn't "will AI replace our analysts" — it's "can AI be the analyst we never hired?"
The answer is yes, with one condition the enterprise content never has to spell out: AI is only as defensible as the definitions underneath it. Pointed at three systems that disagree, AI confidently reconciles nothing — it just produces wrong numbers faster. Pointed at a metric dictionary over joined data, it does the work of the analyst you skipped: the matching, the refreshes, the first draft of every board answer. The system in this post is, concretely, how a startup makes AI financial reporting trustworthy.
Doing this with Definite
The honest pitch, briefly. Definite is the system above, packaged. You get 500+ connectors (QuickBooks, Stripe, Xero, NetSuite, every major CRM) with storage and modeling included, your metric dictionary implemented as governed definitions, and Fi — an AI analyst that answers questions from those definitions with inspectable SQL underneath. Setup is connect-and-go; your first cross-system numbers arrive the same afternoon, not after a quarter-long project. Pricing is one flat platform fee — $250/month, unlimited users, with AI usage metered past an included allowance (pricing). Flat matters here because per-seat pricing is how reporting tools quietly become single-player; with one price, the CEO, the finance lead, and the board observer are all looking at the same governed numbers — no "can you export that for me" round-trips before a meeting.
If you'd rather assemble it yourself: a warehouse, an ingestion tool, a modeling layer, a BI tool, and the time to make them agree. The system in this post works either way. One of them is a weekend.
→ More on the finance setup specifically: Definite for finance teams.
FAQ
The board wants NRR by segment and my revenue data is split across Stripe, the CRM, and QuickBooks. Where do I start? Step 3, then Step 4: write the NRR definition (including what counts as a segment), then make Stripe and the CRM agree on who the customer is. The number falls out of those two moves; the dashboard is last.
What's the lightest-weight reliable setup without hiring a data engineer? Snowflake + dbt feels like overkill. It is overkill at startup scale. You need the five-question dictionary and joined sources — via an all-in-one platform, that's a weekend. The assembled warehouse-and-pipelines stack is what you build when you have a data team that wants to own infrastructure — a staffing choice, not a maturity milestone. The definitions and source map you write here transfer either way.
Why does an AI tool calculate MRR differently from my spreadsheet? Almost always definitions, not arithmetic — one-time charges leaking into recurring revenue is the classic. To find the delta, compare which charges each number includes, not the totals. Neither number is trustworthy until the definition is written down; that's what the metric dictionary fixes.
What does a metric definitions document look like? The Step 3 table: metric, definition, formula, dimensions, source, owner. One page covers a Series A startup.
If I switch systems mid-year, what about numbers not matching what I've reported? Expected, solvable, standard: run the new system against prior quarters, reconcile the deltas, restate with a footnote. See Step 6 — fixing this before diligence is the cheap version.
What will investors actually check in due diligence? That your reported metrics tie back to source systems — they'll recompute revenue, retention, and burn from Stripe and the GL. If your numbers come from written definitions over joined data, diligence is a formality instead of an archaeology project.
The board will keep asking harder questions — that's their job. The fix was never a better dashboard. Define the metrics once, make the systems they come from agree, let AI carry the plumbing, and sign numbers you can trace. Try Definite free or see how it fits finance teams specifically.