RevOps Analytics: Pipeline Math That Connects Your CRM to Revenue Without a Data Team

Before the board meeting, the CEO asks a question that shouldn't require a spreadsheet: "Pipeline says $2M — why did we only collect $800K last quarter?" You pull up HubSpot: $2.1M in open and closed-won pipeline. You pull up Stripe: $820K in subscription revenue.
The gap isn't sloppiness. It's structural.
HubSpot counts a deal as revenue when a rep marks it "closed-won." Stripe counts it when billing starts. Some of those "closed-won" deals are still in contract negotiation. Others started on a free trial and never upgraded. One deal split into three subscriptions; another was a prepaid annual that Stripe booked in a single month. Four separate reasons the numbers disagree, and none of them are a data error.
Every forecast review becomes a reconciliation ritual: export CSVs from HubSpot, pull billing data from Stripe, try to match deal names to subscription IDs, and cobble together a spreadsheet you're maybe 80% confident in.
The CEO looks at it and says "this doesn't match what I saw in HubSpot."
Of course it doesn't.
You are the join between your CRM and your billing system, and that's exactly the problem. RevOps analytics doesn't fail at the dashboard. It fails where your CRM pipeline and your billing system disagree on what "revenue" means. Define the pipeline math once over joined data, and the dashboard is an afternoon. Keep stitching spreadsheets, and you'll never stop being the person everyone asks.
One disclosure before we start: Definite is an all-in-one analytics platform, so we'll show each step working in Definite as the running example. The system itself is tool-agnostic — you could execute it with a warehouse and a hired analyst. The argument of this post is that you shouldn't have to.
The system in brief:
- Start from the five decisions your RevOps team actually makes each week — not from the metrics your CRM reports happen to show you.
- Apply the pipeline math: leads × conversion rate × average deal size × velocity. Every metric traces to one of these four multipliers.
- Write a metric dictionary: each metric defined once, with a formula, the dimensions it must be cut by (by rep, by segment, by stage), a source system, and an owner. A metric without its dimensions is a vanity number.
- Map every metric to its source systems and fix the places where CRM and billing disagree — this is where RevOps analytics actually breaks, and where AI now does the heavy lifting.
- Build the dashboard last. Distribute answers where people work (Slack, the Monday forecast review, scheduled alerts).
- Keep numbers calibrated: one owner per metric, a monthly reconciliation between CRM pipeline and actual revenue.
Total time with modern tooling: an afternoon to stand up, then the first monthly reconciliation is where the numbers earn trust. No data engineer, no warehouse project.
Why your CRM and billing system disagree on revenue
Before fixing anything, it helps to know why HubSpot or Salesforce and Stripe show different revenue numbers. It isn't sloppiness — each system is answering a different question from different data:
- Different definitions of "closed." HubSpot counts a deal as closed-won when a rep moves it. Stripe counts revenue when a subscription starts billing. A deal closed in June that starts billing in July: HubSpot says June revenue, Stripe says July. Neither is wrong.
- No shared deal ID. HubSpot knows a deal object. Stripe knows a subscription. With no shared identifier, answering "did this deal actually become a paying customer?" requires matching deal
HubSpot-12345to subscriptionsub_ABCmanually — every single month. - Different grain. HubSpot counts deals. Stripe counts subscriptions and invoices. One deal can become multiple subscriptions (multi-product). One subscription can span multiple deals (expansion). Summing across them without alignment is how "$2M pipeline" and "$800K collected" both look right.
- Timing and stage definitions. The deal was created in March, moved to "negotiation" in April, marked "closed-won" in May, and the first payment arrived in June. Which month gets credit? Each system answers differently, and none of them are wrong.
Step 1: Start from the decisions, not the metrics
A useful framing from measurement theory — the Goal-Question-Metric approach — says you never start with available data. You start with the decisions someone actually needs to make, and let those dictate the metrics.
For a startup RevOps team, the decisions are predictably few:
| The decision | The question behind it | The metric that answers it |
|---|---|---|
| Scale or pause outbound | "Which reps and segments are converting — and at what cost?" | Rep-level conversion rate, segment CAC, pipeline contribution by source |
| Commit the forecast | "Is our pipeline coverage real, or are we counting stale deals?" | Pipeline coverage ratio, deal aging, weighted pipeline |
| Diagnose deal velocity | "Where are deals stalling?" | Stage conversion rates, time-in-stage, pipeline velocity |
| Reconcile with finance | "Why doesn't forecast match actual revenue?" | Forecast accuracy, CRM-to-Stripe reconciliation |
| Report to the board | "What's our sales efficiency and how is it trending?" | Sales efficiency ratio, magic number, CAC payback |
Five decisions. If your analytics answer these five reliably, cut by the dimensions that matter, you're ahead of most RevOps teams at your stage. Everything else is optional until it isn't.
Step 2: The pipeline math — four multipliers that explain revenue
Finance teams decompose a north-star metric into a tree of drivers (that's how the finance version of this guide works — runway decomposes into cash and net burn, and each branch traces to a source system). Marketing metrics are journey-shaped — a funnel with conversion rates at each stage. RevOps metrics are neither. They're multiplicative:
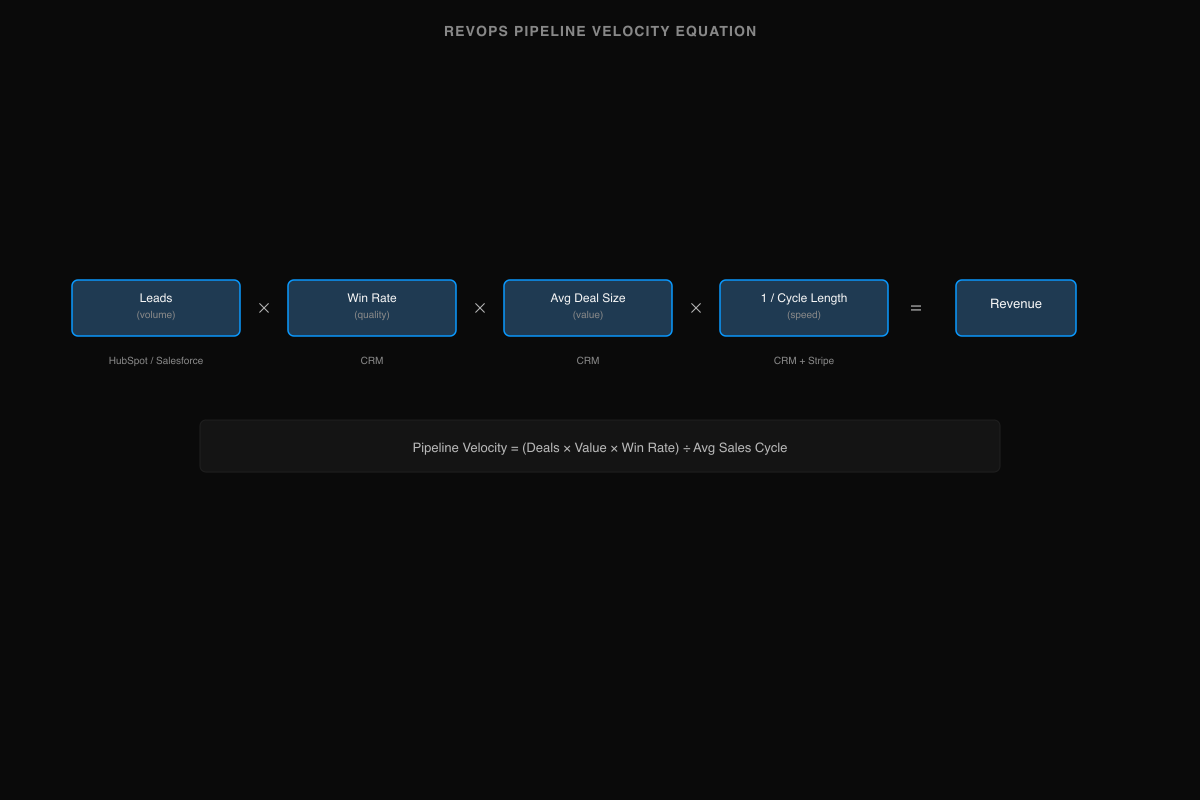
Revenue = Leads × Conversion Rate × Average Deal Size × Velocity
These four multipliers are the framework. Every metric in your system either measures one of them directly or supports a decision about one of them. When pipeline coverage is weak, the diagnosis is in one of these four: not enough leads (volume), poor qualification (conversion), deals too small (deal size), or cycles too long (velocity).
The standard pipeline velocity formula makes this concrete:
Pipeline Velocity = (Number of Deals × Average Deal Value × Win Rate) ÷ Average Sales Cycle Length
A single number that captures quantity, quality, and speed. When it drops, the four multipliers tell you which lever broke. When it rises, they tell you which lever to protect.
One caveat the formula doesn't surface: win rate is only as good as your deal hygiene. If "closed-won" in your CRM includes deals that never converted to paying subscriptions — and at most startups, some percentage does — then your win rate is inflated, your pipeline coverage is optimistic, and every metric downstream is wrong. This is why Step 4 (connecting CRM to billing) isn't optional plumbing — it's what makes the math trustworthy.
Step 3: Write the metric dictionary — definitions with dimensions
This is the artifact most RevOps teams never create. One page. Each metric: a definition, a formula, which of the four multipliers it measures, the dimensions it must be cut by, the system it comes from, and a single owner.
Dimensions are not decoration. "Win rate is 28%" is a number you can't act on; "win rate is 35% for mid-market, 18% for enterprise, and 12% for deals sourced from outbound — and enterprise is trending down" is a coaching conversation. Metrics without their dimensions are trivia.
| Metric | Multiplier | Definition | Formula | Cut by | Source | Owner |
|---|---|---|---|---|---|---|
| Pipeline velocity | All four | Speed of revenue generation | (Deals × Avg value × Win rate) ÷ Avg cycle length | Segment, rep, quarter | CRM + Stripe | RevOps lead |
| Pipeline coverage | Volume | Pipeline size relative to target | Open pipeline ÷ Revenue target | Segment, quarter, stage | CRM | RevOps lead |
| Win rate | Conversion | Deals won vs. total qualified opps | Won deals ÷ Total qualified opps | Rep, segment, source | CRM + Stripe | Sales + RevOps |
| Average deal size | Deal size | Mean revenue per closed deal | Total revenue ÷ Deals closed | Segment, plan/tier, rep | CRM + Stripe | RevOps |
| Sales cycle length | Velocity | Days from qualified opp to close | Avg (close date − opp create date) | Segment, deal size, source | CRM | RevOps |
| Stage conversion | Conversion | Stage-to-stage progression | Stage N+1 count ÷ Stage N count | Rep, segment, period | CRM | Sales + RevOps |
| Forecast accuracy | All four | How close forecast hits actual | Actual revenue ÷ Forecasted revenue | Quarter, rep, segment | CRM + Stripe | RevOps + finance |
| Sales efficiency | All four | Revenue return on sales spend | Net new ARR ÷ Sales & marketing spend | Quarter, segment | Stripe + payroll | Finance + RevOps |
Steal this table. Change the dimensions to match how your business actually segments. The "multiplier" column is what makes this more than a list — it tells you why each metric exists and which lever it informs. When pipeline velocity drops, you don't stare at the number; you check which multiplier moved.
Step 4: Map your sources and make them agree
Now the step every guide compresses into "gather your data" — the one that's actually the whole problem.
For each metric in your dictionary, write down which system owns the underlying data, what field lets you match records across systems, and where that matching usually breaks:
| Data | System of record | Matched on | Where it breaks |
|---|---|---|---|
| Deals, pipeline, stages | HubSpot / Salesforce | deal ID → contact email → account | Duplicate contacts; "closed-won" ≠ paying; stage definitions vary by team |
| Revenue, subscriptions | Stripe | subscription ID → customer email | Subscription ≠ deal (multi-product, expansion); billing start ≠ close date |
| Activity, engagement | CRM + email/call tools | contact email | Volume ≠ quality; activity scoring is noisy |
| Marketing source | GA4, ad platforms, UTMs | UTM → lead → deal | Attribution breaks at the MQL-to-deal handoff |
| Product usage | App DB / events | account_id | Product signals don't map to CRM deal stages |
This is the table that explains the board-meeting gap. HubSpot says $2M because it counts deals. Stripe says $800K because it counts subscriptions. The $1.2M difference lives in deals that haven't started billing, deals that churned before first payment, and deals whose contract terms don't match CRM amounts. Your reconciliation spreadsheet is doing the work this table describes — manually, every month.
The traditional fix is a data project: a warehouse, ingestion pipelines, transformation jobs. Months to build, plus a $130–190K/year analytics hire to maintain it forever. (Run your own numbers: data stack cost calculator.) One RevOps leader we talked to had the technical skills to build the SQL connectors himself — but chose not to, because being the only person who could maintain them meant the company depended on him for every data question. The problem isn't capability; it's organizational leverage.
This is the step where AI has genuinely changed the answer. The plumbing — syncing CRM pipeline data with Stripe billing, matching deals to subscriptions, reconciling amounts and timing — is exactly the work AI handles well, because it's pattern matching with a verifiable result. In Definite, connecting Salesforce or HubSpot and Stripe takes a few minutes each; your metric dictionary from Step 3 becomes the governed definitions — the semantic layer — that the AI must follow.
The division of labor: AI reconciles the systems. You sign the numbers.
Everything the AI builds lands as inspectable tables — including which deals it matched to which subscriptions, and why — so you can audit the logic before a number reaches a board deck. The SQL underneath is always visible: drag-and-drop when your CEO needs an answer, SQL when you want to verify the joins yourself. Any tool — including ours — that offers instant pipeline metrics without showing the joins underneath is asking you to present an unauditable forecast to your board.
Step 5: Build the dashboard last — distribute answers where people work
With definitions and joins in place, the dashboard genuinely is the easy part: one view per decision is plenty. Pipeline analytics templates don't fix any of this — a chart of numbers your CEO doesn't trust is just faster mistrust.
Two upgrades worth making at this stage:
- Answers where people work. A weekly pipeline digest in Slack beats a dashboard nobody opens. Alerts when pipeline coverage drops below your threshold or deal aging exceeds 90 days beat discovering it during board prep. One RevOps founder we spoke with wanted the reports themselves to direct his BDR team's focus — so he could stop being the one who delivers that message manually each week.
- Ad-hoc questions from governed definitions. When the CEO asks "what's our pipeline velocity for enterprise deals excluding that churned account?" you want to ask it in plain English and trust the answer because it's computed from the dictionary, not improvised. That's what Fi, Definite's AI analyst, does.
Step 6: Keep the numbers calibrated
RevOps-grade isn't a precision standard, it's a trust standard. Three habits:
- One owner per metric. The dictionary already names them. When pipeline velocity is computed differently in the board deck vs. HubSpot's built-in pipeline report, the owner decides — and explains the difference to the room.
- Monthly reconciliation. Once a month, CRM pipeline vs. Stripe revenue. This is the step that catches the deals that were "closed-won" but never converted to paying subscriptions — the gap that makes forecast accuracy impossible if you let it compound.
- Cross-check the narrative. When you switch from "whatever the CRM says" to cross-system pipeline math, some reps will look better, some worse, and some "closed" deals will turn out to never have generated revenue. That's a coaching conversation, not a data error. Have it explicitly; don't let it surface as a surprise in the board deck.
AI RevOps analytics: the startup version is a different problem
If you search "AI sales analytics," everything you'll find is written for enterprises — conversation intelligence, predictive deal scoring, ML-driven forecasting with years of training data. Useful, and irrelevant to a startup with 20 reps and one person running RevOps.
The startup version of the problem is the inverse: there is no data team to build the CRM-to-billing reconciliation. The question isn't "will AI replace our sales analyst" — it's "can AI handle the CRM-to-Stripe reconciliation so pipeline numbers actually mean something?"
The answer is yes, with one condition the enterprise content never has to spell out: for consistent, trustworthy results, AI needs definitions underneath it. You can point AI at CRM exports and get useful ad-hoc analysis — but it will inherit every definition disagreement between HubSpot and Stripe, and two people asking the same question will get different answers. Point it at your metric dictionary over joined data, and it does the work of the analyst you skipped: pipeline diagnostics, forecast accuracy tracking, deal velocity analysis, and the first draft of every board answer. The system in this post is, concretely, how a startup makes AI RevOps analytics consistent enough to trust.
Doing this with Definite
The honest pitch, briefly. Definite is the system above, packaged — one platform that handles the full path from source connection to board-ready answer, no warehouse project, no transformation layer to maintain, no reconciliation spreadsheet. Every source from Steps 1–4 is covered: Salesforce, HubSpot, Stripe, GA4, and hundreds more. Your metric dictionary becomes the semantic layer the AI must follow, and Fi — Definite's AI analyst — answers questions from those definitions with inspectable logic underneath.
Start free — the free tier includes the full platform with two connectors, no budget approval required. When you're ready, pricing is one flat fee: $250/month, unlimited users (pricing). Flat matters because per-seat pricing is how analytics tools quietly become single-player — and RevOps analytics is, by definition, cross-functional.
If you're on HubSpot specifically and want the integration-level walkthrough, see our HubSpot RevOps data automation guide.
If you'd rather assemble it yourself: a warehouse, an ingestion tool, a modeling layer, a BI tool, and the time to make them agree. The system in this post works either way. One of them is an afternoon.
→ More on the RevOps setup specifically: Definite for RevOps teams.
FAQ
How do I calculate pipeline velocity? Step 2: (Number of deals × Average deal value × Win rate) ÷ Average sales cycle length. But the formula is only useful when "deal value" means the same thing in your CRM and your billing system. Step 4 is where most teams get stuck.
What RevOps metrics should I report to the board? The Step 1 table: pipeline coverage, forecast accuracy, sales efficiency ratio, pipeline velocity, and win rate — cut by the dimensions the board actually asks about (by segment, by quarter, by rep cohort). Five metrics, not fifteen.
Why doesn't my HubSpot forecast match Stripe revenue? Step 4: HubSpot counts "closed-won" when the rep marks it. Stripe counts revenue when billing starts. A deal closed in June that doesn't bill until July creates a gap that compounds every month. The fix is a shared definition over joined data, not a better CRM report. For the HubSpot-specific walkthrough: HubSpot RevOps Data Automation.
What's a good pipeline coverage ratio? The standard benchmark is 3–4x, but the real formula is simpler: required coverage = 1 / your historical win rate. If your win rate is 25%, you need 4x coverage; if it's 15%, you need nearly 7x. The ratio is only meaningful when you've removed stale deals and your win rate is computed from deals that actually converted to revenue. Pipeline coverage with deals sitting in "negotiation" since January isn't coverage — it's fiction.
How do I connect Salesforce data to Stripe? Step 4: match on customer email or a synced account ID. Email is usually the join key, but duplicate contacts, merged accounts, and shared company domains break it. This is identity matching — either manual reconciliation or the kind of pattern matching AI handles well.
How do I measure RevOps performance without a data analyst? This guide. Steps 1–4 get your CRM and billing data connected and your pipeline metrics defined; the AI carries the joins from there. The system works without SQL or a warehouse project.
Pipeline will keep getting harder to predict as your deal structure gets more complex — multi-product, usage-based pricing, expansion revenue, annual prepays. That's growth. The fix was never a better CRM report or a fancier forecasting model. Define the pipeline math once, connect the systems it depends on, let AI carry the joins, and sign numbers you can trace from board deck to billing system. Try Definite free or see how it fits RevOps teams specifically.