How to Build Unified Analytics Across Multiple Shopify Stores
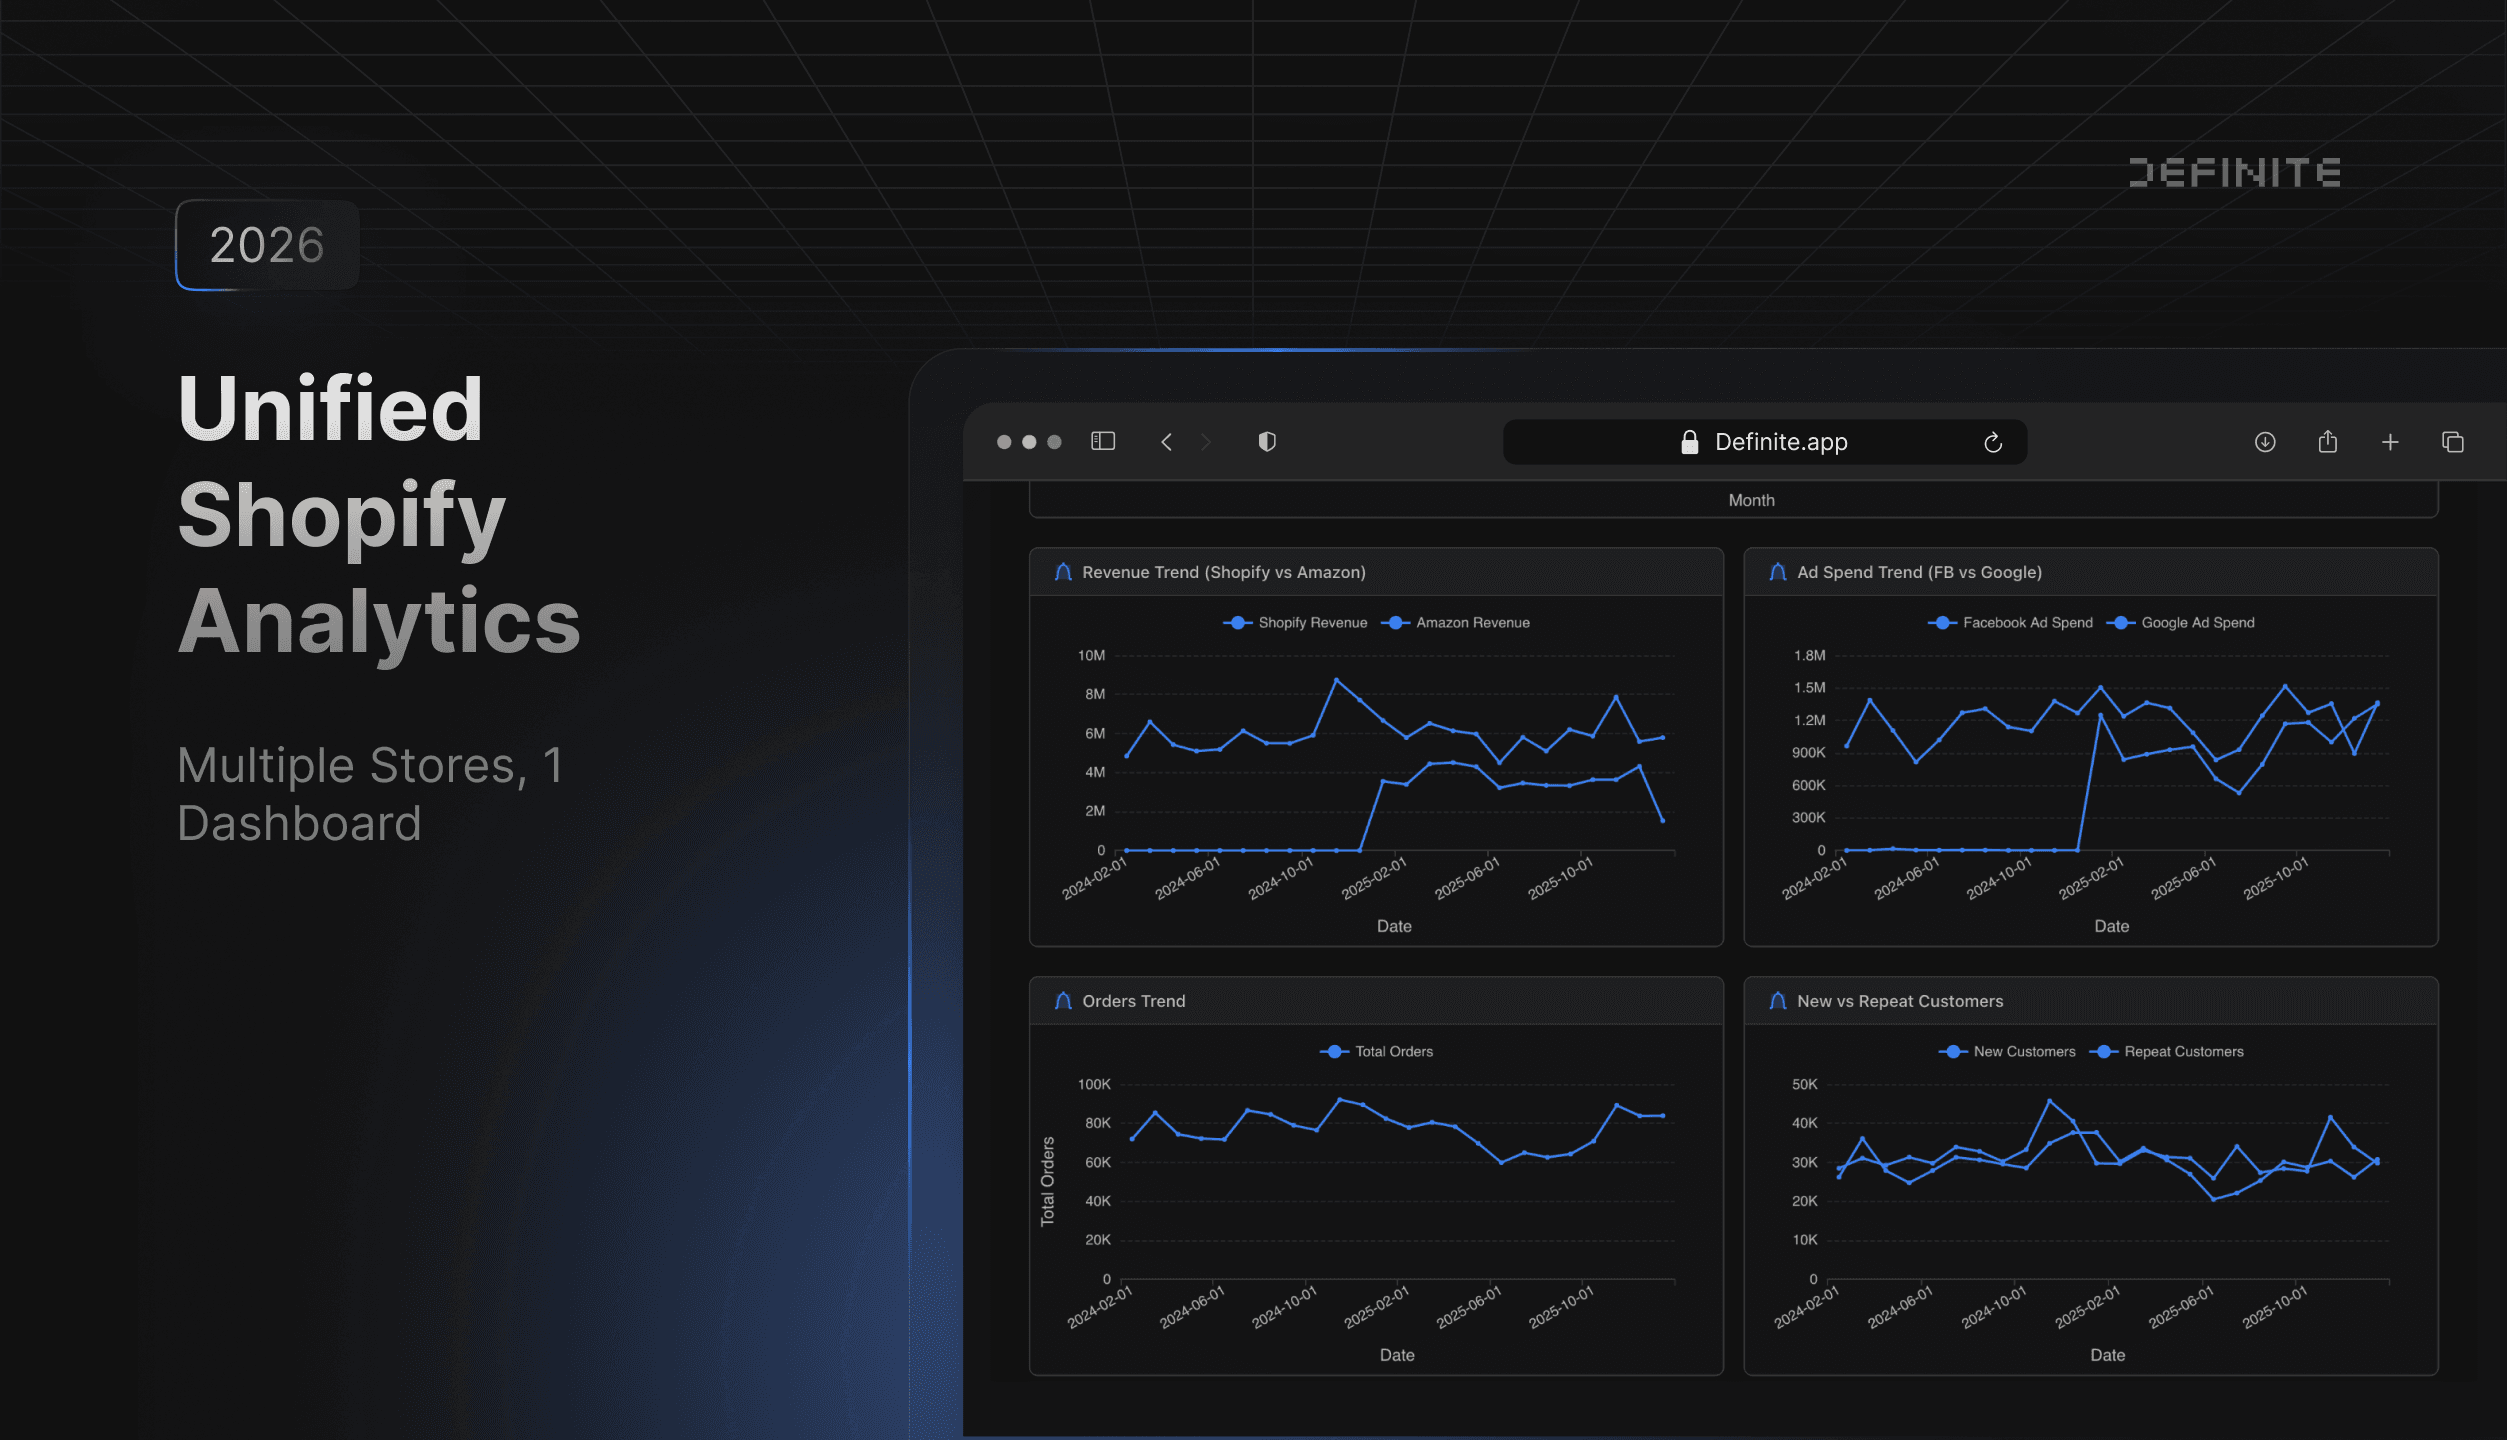
Running multiple Shopify stores? Most teams either struggle with Shopify's limited native analytics or end up stitching together Fivetran, BigQuery, and Looker just to get a unified dashboard. Definite gives you a simpler path: sync all your stores to a managed data warehouse, build unified views across brands, and ask questions in plain English.
Table of Contents
- The Problem with Multi-Store Reporting
- What the Alternatives Get Wrong
- How to Build Unified Shopify Reporting in Definite
- What You Get
- Who Is This For?
- Get Started
The Problem with Multi-Store Reporting
If you've ever tried to build unified reporting across multiple Shopify stores, you know the pain.
Most teams go one of two routes: use a BI tool like Tableau, Looker, or Power BI with native connectors, or stitch together Fivetran, BigQuery, and Looker just to get a unified dashboard.
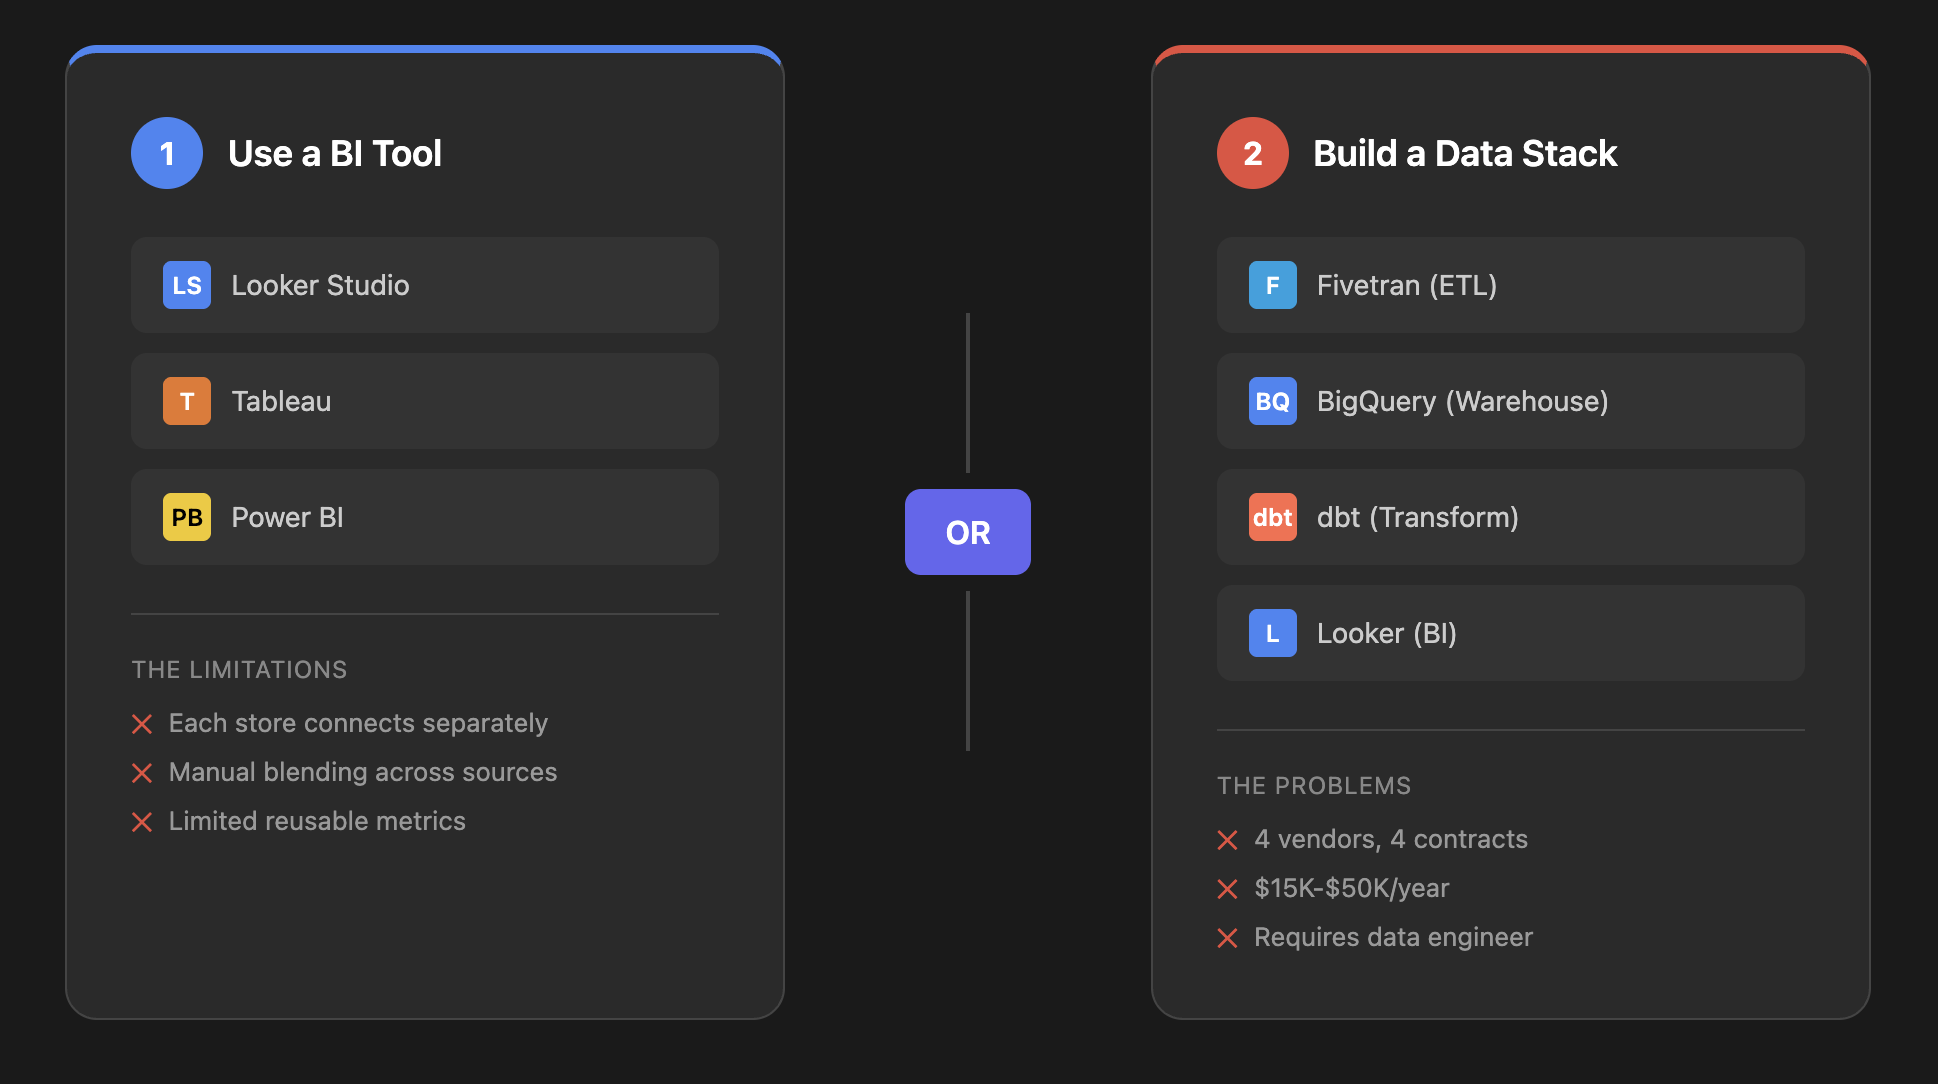
Option 1: Use a BI Tool with Native Connectors
The simplest approach is connecting a BI tool directly to Shopify:
- Looker Studio (free, native Shopify connector)
- Tableau (Shopify connector via partner)
- Power BI (Shopify connector)
- Metabase or Preset (community connectors)
This works for basic reporting on a single store. But these tools hit walls quickly: you can't aggregate data across multiple stores, you can't blend Shopify with Facebook Ads or Google Ads spend, and you're limited to whatever the native connector exposes. There's also no way to model your data properly. Without a semantic layer or transformation step, you end up with brittle dashboards that break every time your data changes.
Option 2: Build a Data Stack
When BI tools aren't enough, teams stitch together a full data stack:
- ETL tool (Fivetran, Airbyte, Stitch) to sync Shopify data
- Data warehouse (BigQuery, Snowflake, Redshift) to store it
- Transformation layer (dbt) to model and clean it
- BI tool (Looker, Tableau, Metabase) to visualize it
This gives you flexibility, but now you're managing four vendors, four contracts, and four tools. You need someone who knows SQL. And the bill adds up fast. Most teams spend $15,000 to $50,000 per year on this stack before they even build their first dashboard.
The Problems Both Paths Share
Whichever route you choose, you still run into the same underlying issues.
Brand Names Don't Match
When you sync multiple Shopify stores, each one lands in its own schema. That's expected. The problem is that Shopify store names rarely match the brand names in your other systems. Here's what this looks like in practice (these are fictional examples, but you'll recognize the pattern):
| Brand | Shopify Store | Facebook Ads Account | Google Ads Account | Amazon Seller |
|---|---|---|---|---|
| Breeze | breeze-home-store | Breeze_FB_2024 | MCC - Breeze Home | Breeze Home LLC |
| Atlas | atlas-gear-tactical | Atlas Tactical Ads | Atlas_Ads_Main | Atlas Gear Inc |
| Dawn | dawn-club-official | Dawn Club FB | MCC - Dawn Club | Dawn Club LLC |
| Luxe | luxephoto-store | Luxe_Photo_FB | Luxe Photo Ads | Luxe Photo Co |
| Kinetic | kinetic-athletics | Kinetic_Facebook | MCC - Kinetic | Kinetic Athletics |
When you try to join Shopify revenue with Facebook Ads spend, nothing matches. You end up building spreadsheets to map store names manually, and those spreadsheets break every time someone renames a store or adds a new brand.
Calculating Cross-Channel Metrics Is a Nightmare
The metrics that actually matter require data from multiple sources:
| Metric | What You Need |
|---|---|
| MER (Marketing Efficiency Ratio) | Total revenue / Total ad spend (Facebook + Google + Amazon) |
| Blended CAC | Total ad spend / New customers acquired |
| True ROAS | Revenue attributed to all channels, not just one platform |
Shopify alone can't give you these numbers. Neither can Facebook Ads Manager or Google Ads. You need to combine data from all sources, normalize brand names, and calculate metrics across the entire portfolio.
These aren't edge cases. They're the standard experience for any team managing more than a handful of Shopify stores.
What the Alternatives Get Wrong
Teams that outgrow Shopify's native analytics typically explore these options:
| Solution | Annual Cost | What You Get | The Problem |
|---|---|---|---|
| Shopify Analytics | Included | Per-store reporting only (Plus plans add basic org-level views) | No cross-channel blending, no semantic layer, no AI |
| Triple Whale | $6,000-$15,000 | E-commerce attribution | Limited to Shopify ecosystem |
| Supermetrics + Looker Studio | $3,500-$5,000 | Data transfer only | Still need separate BI and warehouse |
| Polar Analytics | $6,000-$12,000 | DTC analytics platform | One dashboard style, limited customization |
| Fivetran + BigQuery + Looker | $15,000-$50,000 | Full stack | High complexity, requires data engineer |
The gap: None of these solutions give you a complete data stack (warehouse + ETL + semantic layer + BI + AI) without requiring a data engineer or paying enterprise prices.
That's the gap Definite fills.
How to Build Unified Shopify Reporting in Definite
We recently built unified Shopify reporting for a holding company managing 11+ e-commerce brands. Here's exactly how we did it.
Step 1: Connect All Shopify Stores
In Definite, you connect each Shopify store as a separate data source. Each store syncs to its own schema in the managed lakehouse.
For this client, we connected 11 stores:
- Breeze, Atlas, Dawn, Luxe, Kinetic, Verde, Summit, Oasis, Coastal, Bloom, and Harbor
Each store has its own tables: orders, customers, products, line_items, and more.
Step 2: Sync Data to the Data Warehouse
Once connected, all your Shopify data syncs automatically to Definite's managed DuckDB lakehouse (DuckLake).
You don't need to provision Snowflake or BigQuery. You don't need to manage infrastructure. The data lands in tables you can query immediately.
For this client, we synced 11 stores with over 3.8 million orders going back to 2021.
Step 3: Build Unified Views
This is where Definite shines. Instead of querying 11 separate schemas, you build a unified view that combines all stores with a brand identifier:
| Source Table | Brand Tag |
|---|---|
| SHOPIFY_BREEZE.orders | Breeze |
| SHOPIFY_ATLAS.orders | Atlas |
| SHOPIFY_DAWN.orders | Dawn |
| SHOPIFY_LUXE.orders | Luxe |
| SHOPIFY_KINETIC.orders | Kinetic |
The unified view uses UNION ALL to combine all stores, adding a brand column to each row. Now every query, dashboard, and report can filter or group by brand without touching 11 separate tables.
Step 4: Build Data Models in the Semantic Layer
In Definite's semantic layer (powered by Cube), you define your metrics and dimensions once:
| Type | Examples |
|---|---|
| Measures | Revenue, Orders, AOV, Customers, MER, CAC, ROAS |
| Dimensions | Brand, Store, Date, Month, Channel, Product |
You also create joins. For this client, we joined Shopify data with:
- Facebook Ads spend by brand
- Google Ads spend by brand
- Amazon Seller Central sales by brand
- A brand mapping table that standardizes store names across all platforms
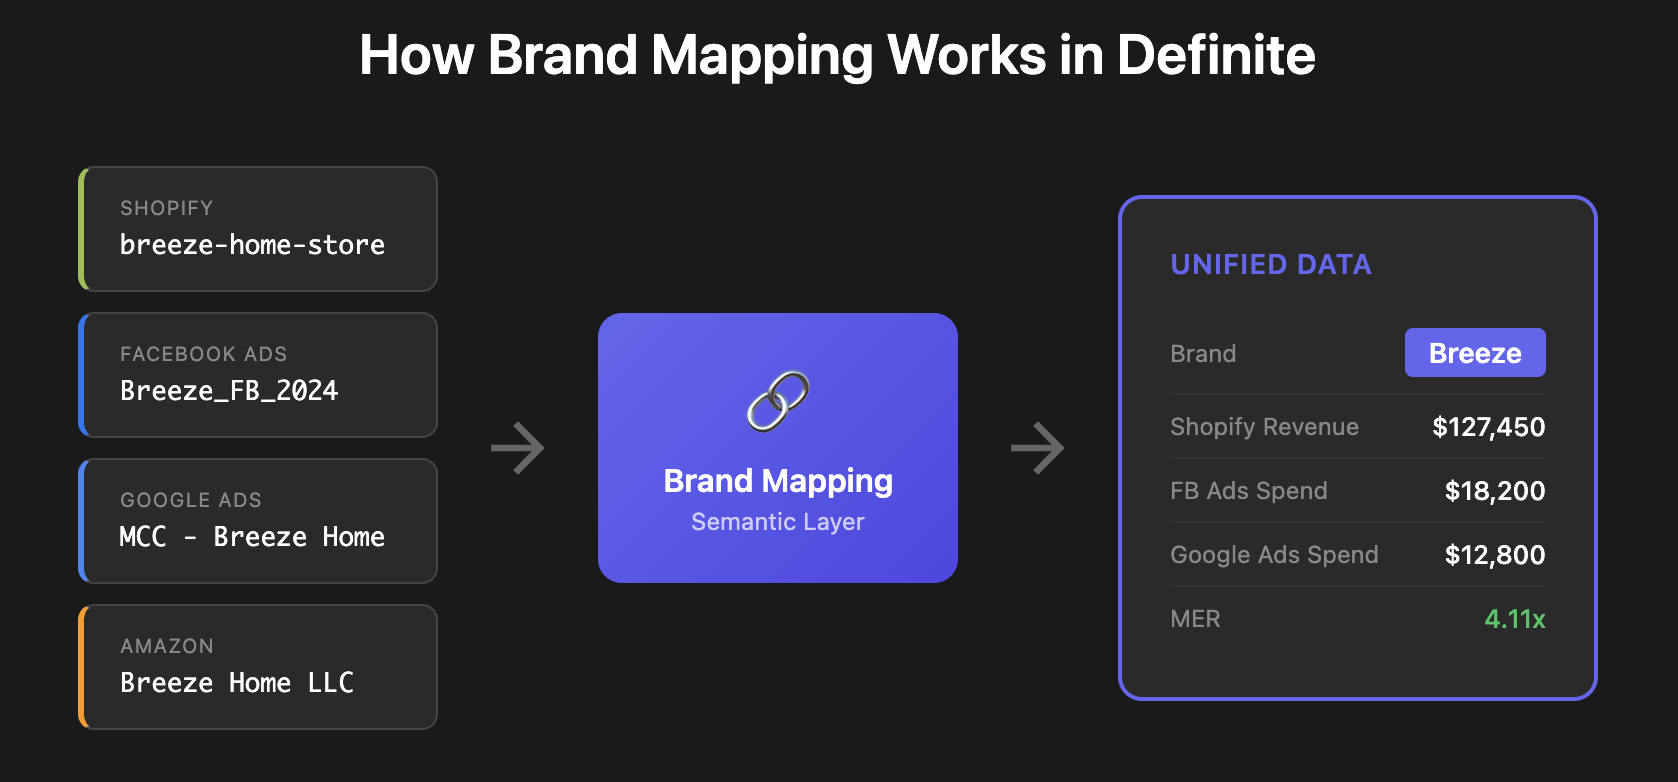
Step 5: Create Brand Mapping
Shopify store names rarely match the brand names you use in Facebook Ads, Google Ads, or Amazon. "breeze-home-store" in Shopify might be "Breeze_FB_2024" in Facebook.
In Definite, you create a simple mapping table:
| Shopify Store | Facebook Account | Google Ads Account | Brand |
|---|---|---|---|
| breeze-home-store | Breeze_FB_2024 | MCC - Breeze Home | Breeze |
| atlas-gear-tactical | Atlas Tactical Ads | Atlas_Ads_Main | Atlas |
| dawn-club-official | Dawn Club FB | MCC - Dawn Club | Dawn |
Join this in the semantic layer, and every dashboard, report, and query uses the same standardized brand names. If your team manages Google Ads through multiple MCC accounts, the same brand mapping approach applies across your manager hierarchy.
Step 6: Build Pre-Aggregated Performance Tables
For fast dashboards with millions of rows, you build materialized tables that pre-calculate key metrics. The semantic layer handles this automatically.
For this client, we created a daily performance table that combines:
- Shopify revenue and orders by brand
- Facebook Ads spend and ROAS by brand
- Google Ads spend and ROAS by brand
- Amazon revenue by brand
- Calculated metrics: MER, blended CAC, portfolio ROAS
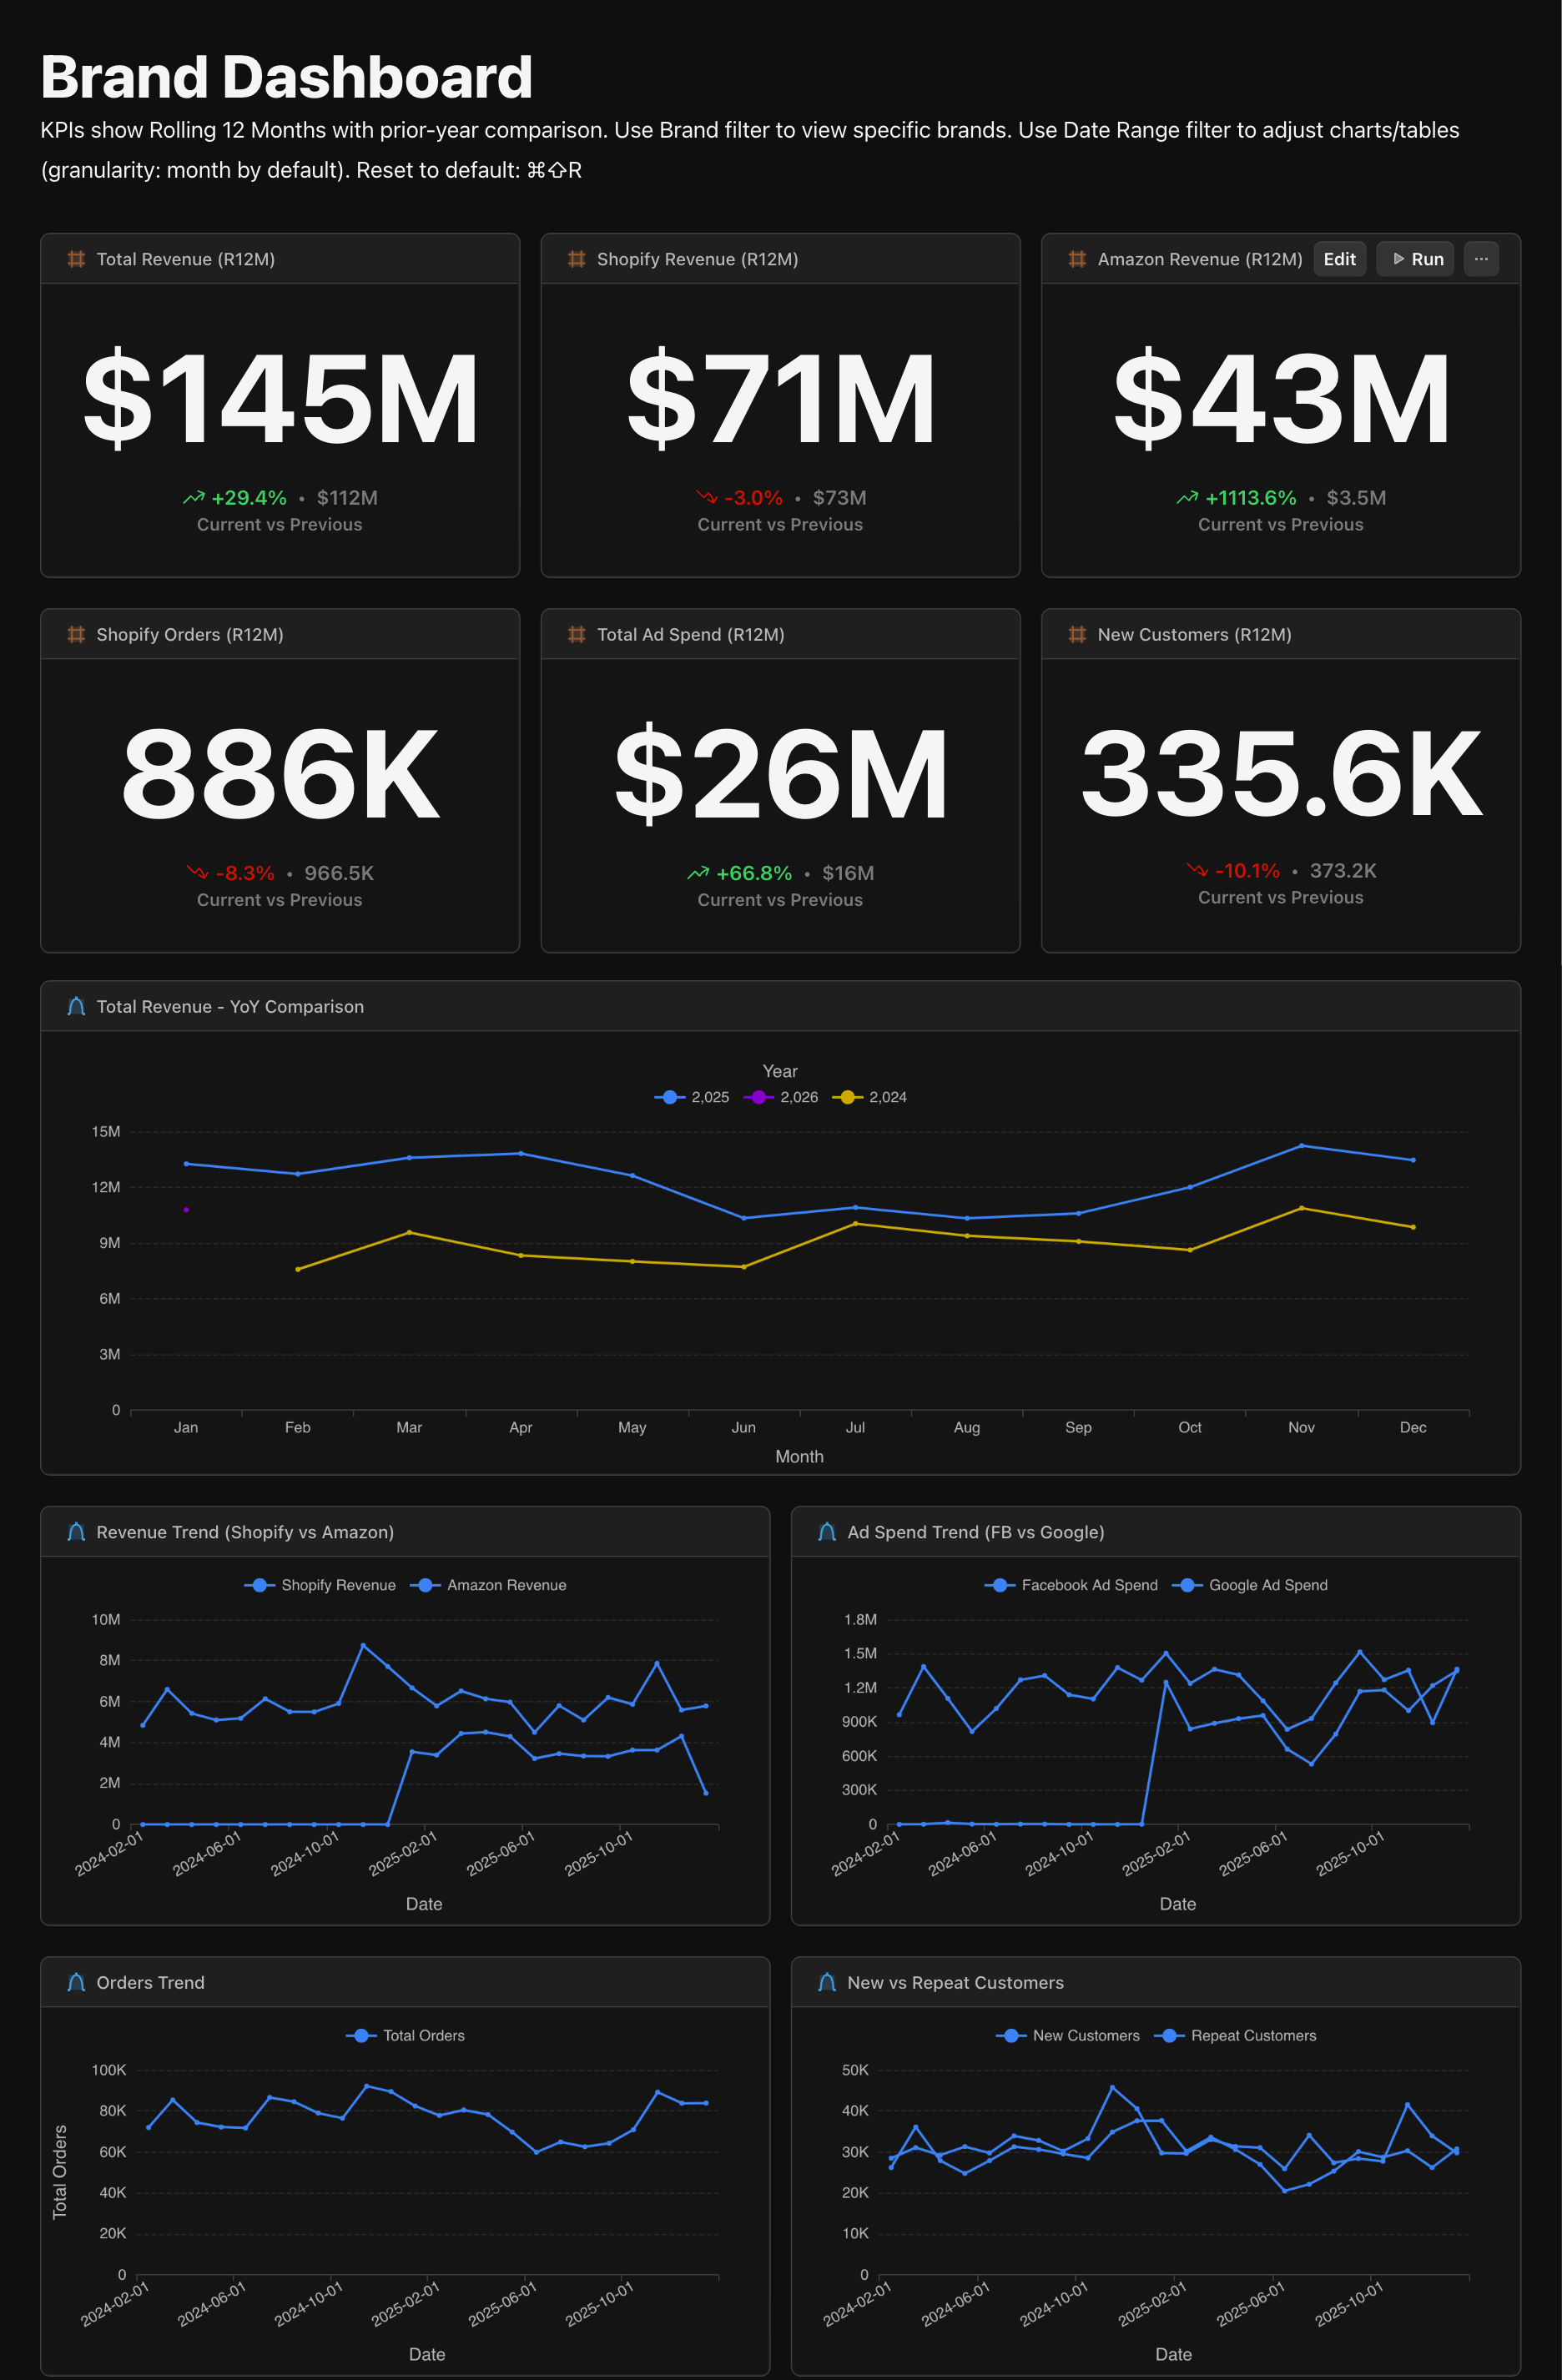
Step 7: Build the Dashboard
Now you have everything you need:
- Total revenue across all brands
- MER and blended CAC by brand
- Revenue vs. ad spend trends over time
- Brand comparison tables
- Cross-channel attribution view
Step 8: Ask Fi
Instead of writing SQL, ask Fi:
- "Which brand has the highest MER this month?"
- "Show me revenue by brand for the last 30 days"
- "Compare Shopify revenue to total ad spend by brand"
- "What's our blended CAC across all brands?"
Fi understands your semantic model, writes the query, and returns the answer with a chart. No SQL required.
What are you missing across stores?
Enter your domain and we'll show you the cross-store questions - blended CAC, unified LTV, inventory gaps - your Shopify data can answer when it's in one place.
Try it with any company domain — no signup required.
What You Get
| Component | What It Does |
|---|---|
| Managed Data Warehouse | All Shopify stores sync to DuckLake automatically |
| Unified Views | Query all stores as one table with brand tagging |
| Semantic Layer | Define MER, CAC, ROAS once, use everywhere |
| Brand Mapping | Standardize messy store names across all sources |
| Pre-Aggregated Tables | Fast dashboards even with 3.8M+ orders |
| Unified Dashboard | All brands in one view, blended with Facebook/Google/Amazon |
| AI Queries (Fi) | Ask questions in plain English, no SQL required |
| Scheduled Automation | Daily syncs, automatic refreshes |
Cost Comparison
| Solution | Annual Cost |
|---|---|
| Shopify Analytics | Free (Plus adds basic org-level views — no cross-channel or AI) |
| Triple Whale | $6,000-$15,000 |
| Supermetrics + Looker Studio | $3,500-$5,000 |
| Polar Analytics | $6,000-$12,000 |
| Fivetran + BigQuery + Looker | $15,000-$50,000 |
| Definite | Starting at $250/month ($3,000/year) (full stack + AI) |
Who Is This For?
- Holding companies (Thrasio model) with 10-200+ brands under management who need portfolio-level visibility
- Multi-brand e-commerce operators running multiple storefronts with separate Shopify accounts
- Agencies managing e-commerce clients who need unified reporting across all their stores
- Performance marketing teams who want to calculate true MER and blended CAC across Shopify, Facebook Ads, Google Ads, and Amazon
If you're tired of managing four separate tools for multi-store reporting or copying data into spreadsheets to calculate cross-channel metrics, this is worth exploring. For cohort LTV analysis across your stores, see how to build cohort LTV heatmaps.
Get Started
Connect all your Shopify stores, sync to a managed data warehouse, and build unified dashboards in one platform.
- Start free: definite.app/signup
- Read the docs: docs.definite.app
- Questions? Email hello@definite.app