Analyze your Facebook Ads data with AI today.
Build dashboards, automate reports, and ask questions in plain English — all from your Facebook Ads data, no complex infrastructure to maintain.
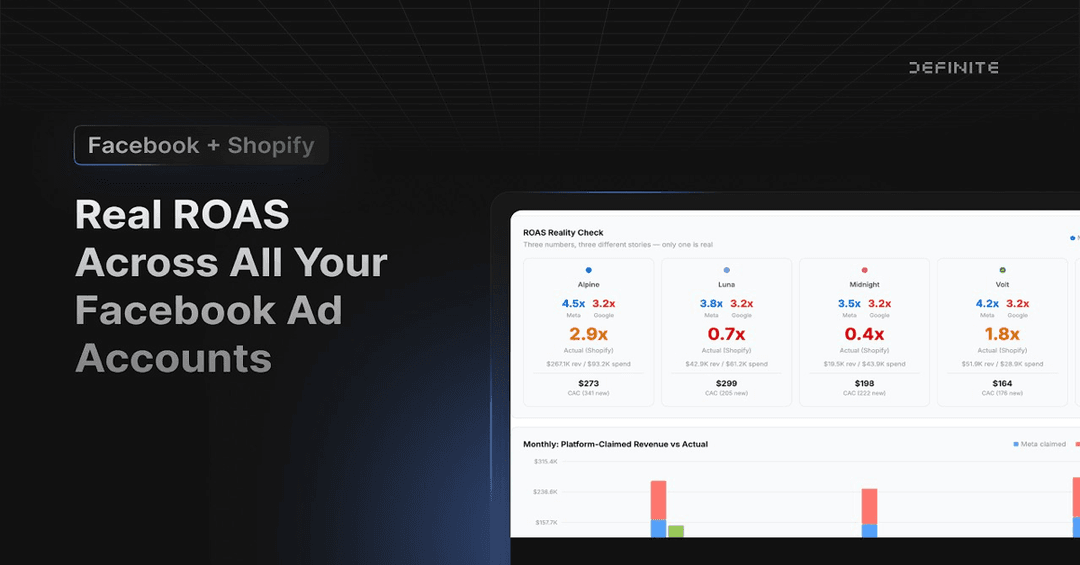
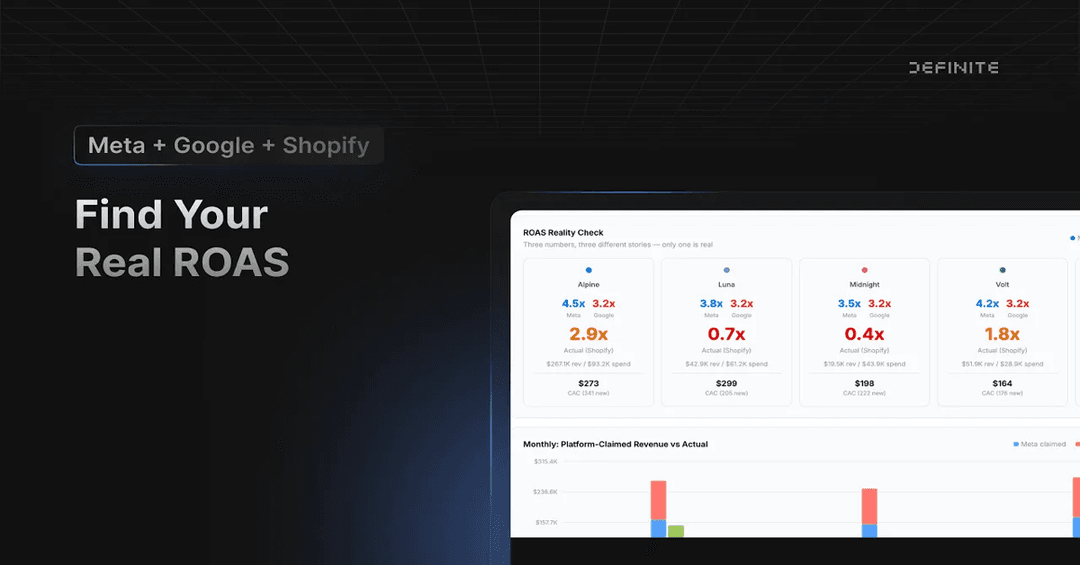
Have multiple Facebook Ads accounts? Analytics across multiple Facebook Ads accounts →
Want it to watch your Facebook Ads data and act on its own? Meet the Facebook Ads agent →


Everything Facebook Ads exposes, modeled and queryable.
Extracts Facebook Ads marketing data: ad accounts, campaigns, ad sets, ads, creatives, images, videos, labels, custom audiences, custom conversions, and the Ads Insights reporting metrics. Enables performance analysis across spend, delivery, engagement, and conversions with flexible breakdowns and time aggregation.
Tables & streams
Represents the billing and governance scope for advertising; used to analyze multi-campaign spend, pacing, currency impacts, and account-level performance rollups.
Top-level marketing initiatives defining objective and budget; enables analysis of campaign performance, budget allocation, pacing, and goal attainment (e.g., ROAS, CPA).
Delivery configuration and targeting layer with schedules, bids, and audiences; supports analysis of targeting effectiveness, budget pacing, and placement/device outcomes.
Individual ad executions linked to creatives; used to measure creative-level delivery, CTR, CPC, CPA, and variation testing within ad sets.
Creative definitions and media (images, videos) used by ads; enables creative performance analysis, message testing, and asset reuse tracking.
Custom audience segments used for targeting; supports analysis of audience size, retention, sourcing, and downstream performance by segment.
Custom conversion definitions representing business outcomes; used for attribution and KPI calculation such as conversion volume, value, and recency.
Tagging taxonomy applied across campaigns, ad sets, and ads; enables flexible grouping, filtering, and rollup reporting by themes or initiatives.
Aggregated delivery, engagement, cost, and conversion metrics with rich breakdowns and time ranges; powers KPI dashboards, cohort analysis, and attribution reporting across account, campaign, ad set, and ad levels.
Uses a Facebook Marketing API access token (Bearer token) tied to your ad account to authenticate
Requires a Facebook Ads account to connect.
Three steps. One afternoon.
Authenticate Facebook Ads in a few clicks. OAuth, API key, or IAM role — we handle secrets and rotation.
We pull every stream into your warehouse. CDC where the API supports it; full + incremental otherwise. Hourly-or-faster, row-level secure.
SQL, dashboards, or ask Fi in plain English. Your Facebook Ads data lives next to every other source — ready to join.
Build your own with the Definite SDK, or request it. Most go live in days.
Pair Facebook Ads with the rest of your data.
Join Facebook Ads with the rest of your data, then ask Fi questions across all of it.