Analyze your Shopify data with AI today.
Build dashboards, automate reports, and ask questions in plain English — all from your Shopify data, no complex infrastructure to maintain.
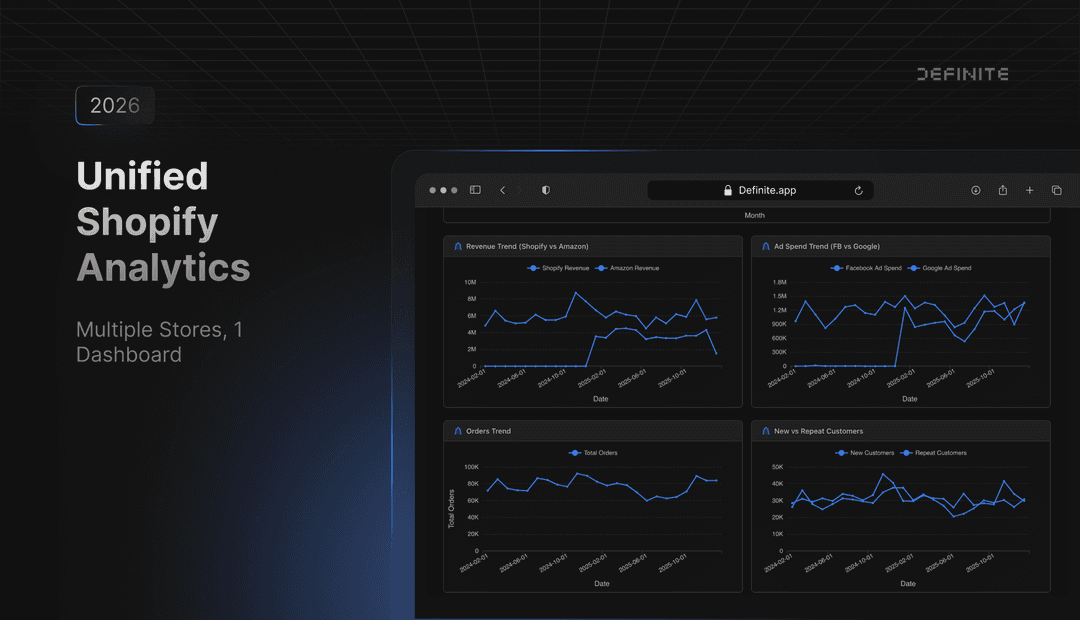
Have multiple Shopify accounts? Analytics across multiple Shopify accounts →
Want it to watch your Shopify data and act on its own? Meet the Shopify agent →


Everything Shopify exposes, modeled and queryable.
Extracts Shopify ecommerce data including orders, customers, products, inventory, collections, transactions, and abandoned checkouts. This enables analysis of sales performance and revenue trends, customer cohorts and retention, product and collection performance, checkout abandonment, and stock levels by location.
Tables & streams
Represents shoppers and their lifecycle; enables segmentation, cohort retention, repeat purchase rate, and customer lifetime value analysis.
Represents completed sales with financial and fulfillment statuses; drives revenue reporting, AOV, order volume trends, and fulfillment SLAs.
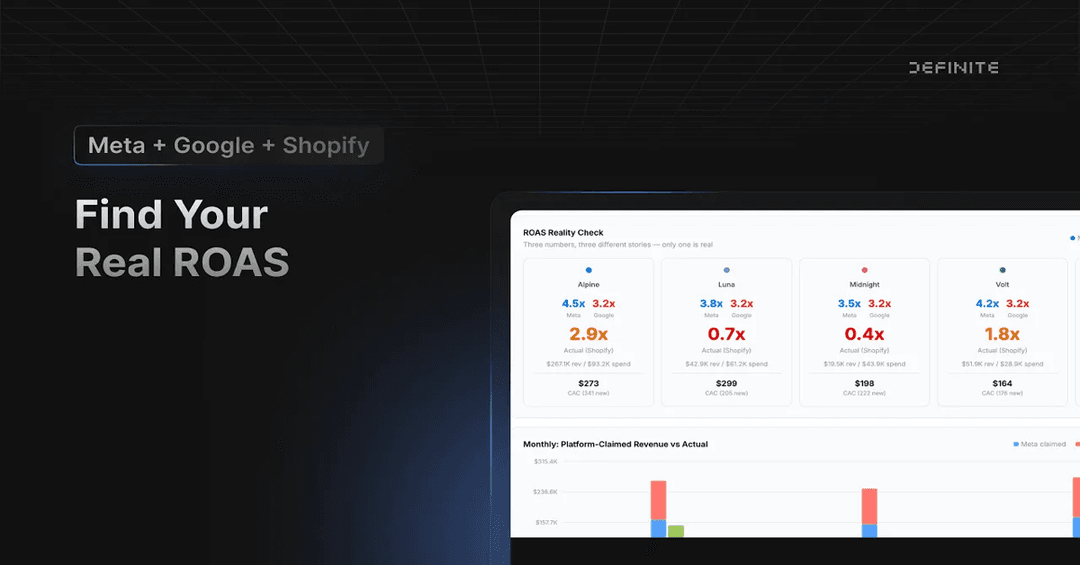
Captures payment events per order (authorizations, captures, refunds) to measure realized revenue, refund rates, and payment method performance.
Catalog of products and variants with pricing and options; supports product and variant performance, pricing impact, and merchandising analysis.
Merchandised groupings of products; used to analyze collection-level sales, discovery, and merchandising effectiveness.
SKU-level inventory entities with tracking settings; enables stock on hand, out-of-stock rates, and replenishment planning.
Fulfillment and inventory locations (warehouses/stores) to analyze stock distribution, allocation, and location-level availability.
Checkout sessions not converted to orders; supports cart abandonment analysis, recovery campaigns, and funnel drop-off insights.
Key–value fields attached to Shopify resources that enrich analysis with custom attributes for segmentation and advanced reporting.
Uses a Shopify Admin API access token for your store (sent as the X-Shopify-Access-Token header) to authenticate
Requires a Shopify account to connect.
Three steps. One afternoon.
Authenticate Shopify in a few clicks. OAuth, API key, or IAM role — we handle secrets and rotation.
We pull every stream into your warehouse. CDC where the API supports it; full + incremental otherwise. Hourly-or-faster, row-level secure.
SQL, dashboards, or ask Fi in plain English. Your Shopify data lives next to every other source — ready to join.
Build your own with the Definite SDK, or request it. Most go live in days.
Pair Shopify with the rest of your data.
Join Shopify with the rest of your data, then ask Fi questions across all of it.