How to Build Cohort LTV Analysis for Your E-Commerce Store

To build cohort LTV analysis, you need three things: your order data in a warehouse, a way to group customers by first purchase month, and a visualization that tracks cumulative revenue over time. Most e-commerce teams either pay $300/month for Lifetimely, export CSVs into spreadsheets, or ask their data team to build something from scratch. Definite lets you do all three in one platform: sync your Shopify data, build cohort models, and render interactive LTV heatmaps with no external tools. And if you run multiple stores, it scales to aggregate across all of them.
Table of Contents
- Why Cohort LTV Analysis Matters
- The Problem with Existing Solutions
- How to Build Cohort LTV Heatmaps in Definite
- What You Get
- Who Is This For?
- Get Started
Why Cohort LTV Analysis Matters
Cohort LTV analysis answers the most important questions in e-commerce unit economics.
You group customers by the month they made their first purchase (the "cohort"), then track how much cumulative revenue they generate over time. The result is a heatmap where each row is a cohort, each column is a month since first purchase, and each cell shows the average lifetime value at that point.
This tells you:
| Question | What the Heatmap Shows |
|---|---|
| When do we break even on CAC? | The month where LTV exceeds customer acquisition cost |
| Which cohorts have the best retention? | Rows where LTV keeps climbing in later months |
| How does LTV evolve over 24 months? | The full progression from first order to mature customer |
| Which products or channels drive the most repeat purchases? | Filtered views showing LTV multiplier differences |
Without this, you're guessing at payback periods, marketing budgets, and channel performance. With it, you can make confident decisions about where to invest.
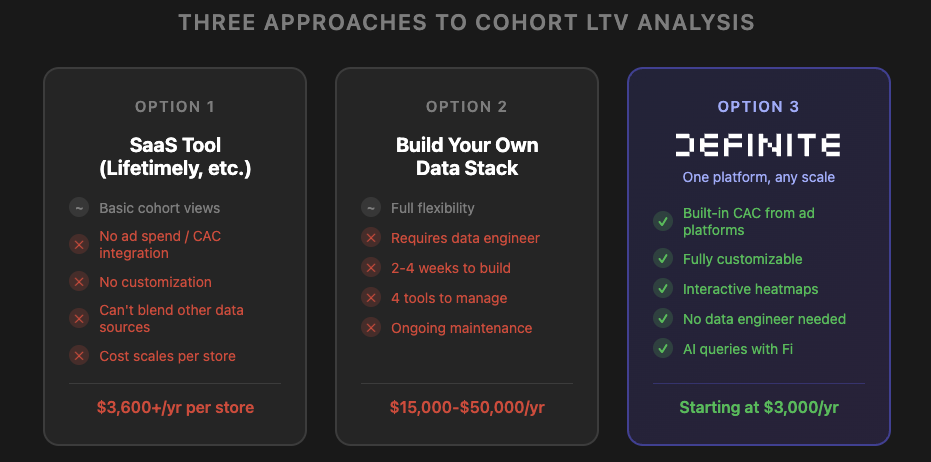
The Problem with Existing Solutions
If you've tried to build cohort LTV analysis for your store, you've probably hit one of these walls.
Option 1: Use a SaaS Tool Like Lifetimely
The simplest approach is plugging in a Shopify app:
- Lifetimely ($300/month per store)
- RetentionX ($500/month)
- Peel Insights ($500/month)
- Triple Whale ($179-$749/month, scaling with GMV)
These work for basic cohort views, but they come with real limitations. You can't blend in ad spend from Facebook and Google for true CAC calculations. You can't customize how cohorts are defined or filtered. And if you run multiple stores, the costs multiply fast ($300/month per store adds up quickly) with no way to aggregate data across them.
Option 2: Build It in Spreadsheets
Some teams export order data from Shopify and build cohort tables in Google Sheets or Excel. This works for a quick snapshot, but it breaks as soon as you need:
- Automatic updates (you're re-exporting every month)
- CAC calculations (you need to pull ad spend from Facebook and Google separately)
- More than 12 months of history (spreadsheets get slow)
- Any customization beyond what you can manually pivot
Option 3: Build a Data Stack
When spreadsheets aren't enough, teams stitch together a full data stack:
- ETL tool (Fivetran or Airbyte) to sync Shopify and ad platform data
- Data warehouse (Snowflake, BigQuery) to store it
- Transformation layer (dbt) to build cohort models
- BI tool (Looker, Tableau) to visualize it
This gives you flexibility, but now you need someone who can write SQL, model cohort logic, and maintain the pipeline. Most teams spend 2-4 weeks just building the initial cohort query, and the ongoing maintenance never stops.
The Problems All Three Paths Share
Whichever route you choose, you still run into the same underlying issues.
CAC Requires Cross-Platform Data
LTV alone is useful, but it only becomes actionable when you compare it to CAC. That means joining order data with ad spend data from Facebook Ads and Google Ads, matching by month. No single Shopify app does this natively.
Static Reports Go Stale
A cohort analysis only works if it updates automatically. Investors, board advisors, and finance teams need current numbers, not a snapshot from three months ago.
Multi-Store? It Gets Worse
If you run more than one store, every problem above multiplies. Each store's order data lives in its own schema, brand names don't match across ad platforms, and none of the SaaS tools can aggregate across stores. You end up paying per-store fees for isolated dashboards with no portfolio-level view.
How to Build Cohort LTV Heatmaps in Definite
Here's exactly how to build cohort LTV analysis in Definite, whether you have one store or twenty. We'll walk through the single-store setup first, then show how it extends to multiple brands.
Every step below can be done manually or by asking Fi, Definite's AI agent. We'll show both approaches.
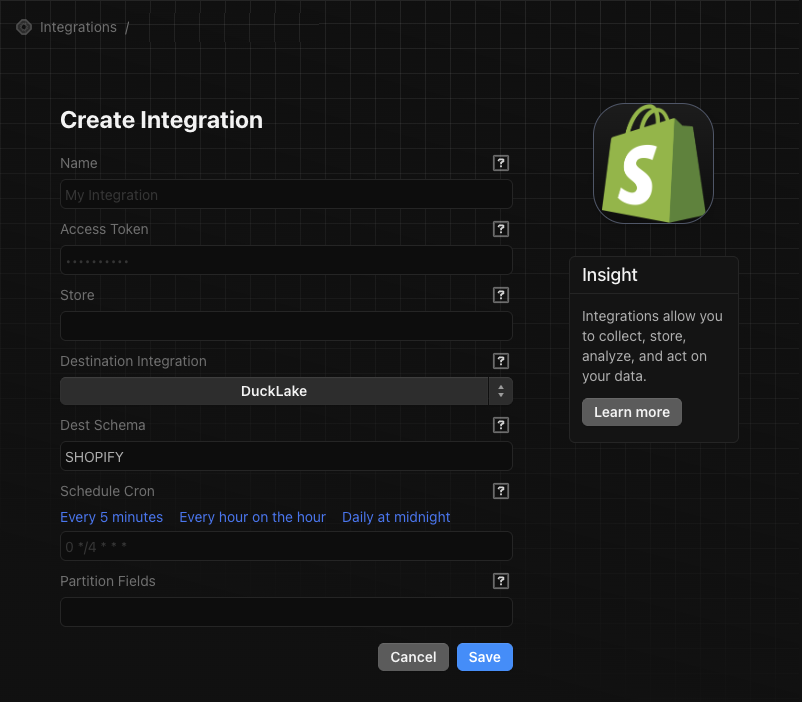
Step 1: Connect Your Data Sources
In Definite, you connect your Shopify store and ad accounts:
| Source | Purpose |
|---|---|
| Shopify | Order and customer data |
| Facebook Ads | Ad spend for CAC calculation |
| Google Ads | Ad spend for CAC calculation |
Each source syncs automatically to Definite's managed DuckDB data warehouse. No Snowflake or BigQuery to provision.
Running multiple stores? Connect them all. Each store syncs to its own schema, and in the next step you'll unify them into a single table.
Ask Fi: "Connect my Shopify store and sync all order data."
Step 2: Build Your Order Table (Unified If Multi-Store)
If you have a single store, your Shopify orders table is ready to query immediately.
If you run multiple stores, you need a unified view that combines all of them with a brand identifier.
Ask Fi: "Create a unified orders view that combines all my Shopify stores with a brand column."
Fi generates something like this:
-- Unified orders across all brands
SELECT 'Breeze' as brand, * FROM SHOPIFY_BREEZE.orders
UNION ALL
SELECT 'Atlas' as brand, * FROM SHOPIFY_ATLAS.orders
UNION ALL
SELECT 'Dawn' as brand, * FROM SHOPIFY_DAWN.orders
-- ... repeat for all stores
This gives you a single table where every row has a brand column. The rest of the steps work the same whether you have one brand or many.
Step 3: Build the Cohort Logic
The cohort calculation has two parts: identify each customer's first order, then calculate cumulative revenue by months since that first purchase.
Ask Fi: "Build a cohort analysis from my Shopify orders. Group customers by first purchase month and calculate cumulative LTV at each month since first order."
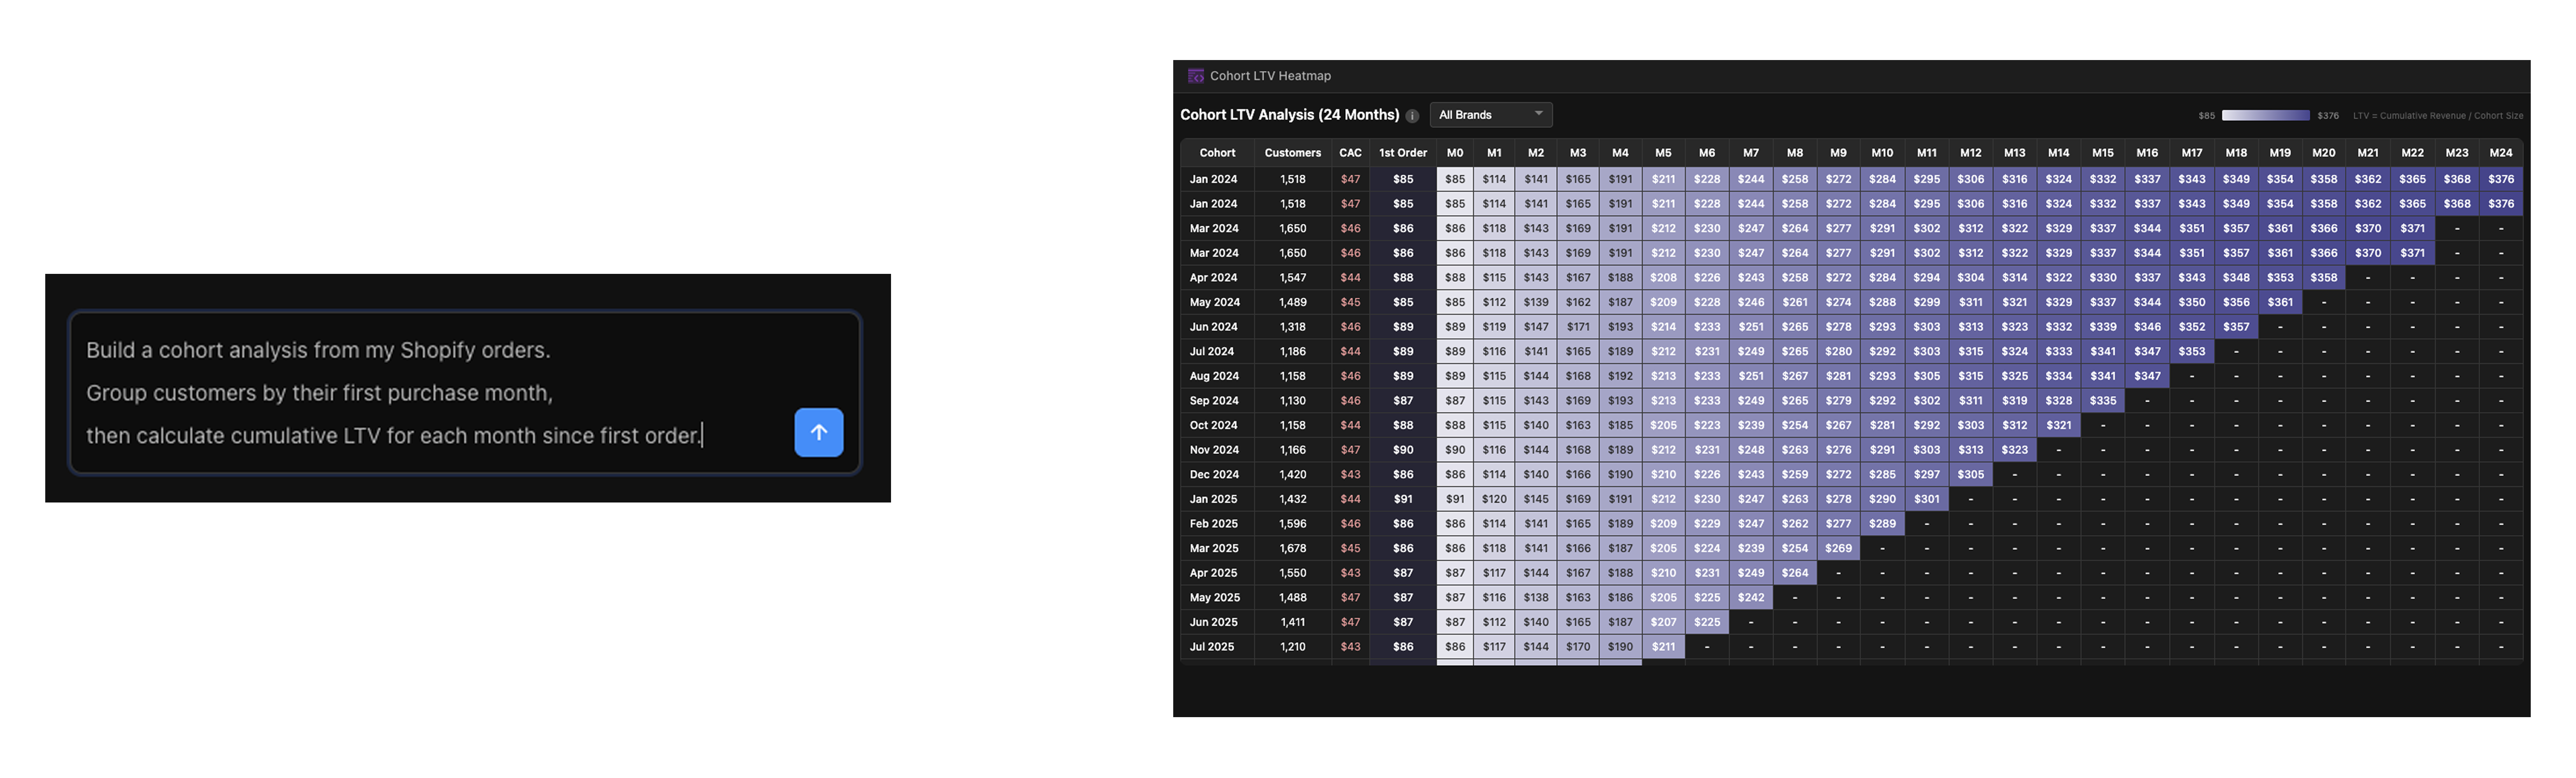
Fi generates the queries for you. Here's what the underlying logic looks like:
First, identify each customer's first order:
SELECT
  email,
  MIN(created_at::DATE) as first_order_date
FROM orders
WHERE email IS NOT NULL
  AND financial_status NOT IN ('refunded', 'voided')
GROUP BY email
Then, calculate cumulative revenue by months since first purchase:
SELECT
  DATE_TRUNC('month', first_order_date) as cohort_month,
  DATEDIFF('month', first_order_date, order_date) as months_since_first_order,
  COUNT(DISTINCT email) as cohort_size,
  SUM(subtotal_price - COALESCE(total_discounts, 0)) as cumulative_revenue
FROM orders_with_first_purchase
GROUP BY cohort_month, months_since_first_order
If you have multiple brands, add brand to the SELECT and GROUP BY clauses to segment by store.
The key metric: LTV = Cumulative Revenue / Cohort Size
This tells you the average revenue per customer at each point in their lifecycle.
Step 4: Add CAC from Ad Platforms
To make LTV actionable, you need to compare it to your customer acquisition cost.
Ask Fi: "Join my Facebook Ads and Google Ads spend data with the cohort table to calculate CAC by month."
Fi aggregates ad spend by month and divides by cohort size:
CAC = Total Ad Spend / New Customers Acquired
Now every cohort row shows both LTV progression and the acquisition cost you need to recover.
What's your actual customer LTV?
Enter your domain and we'll show you the cohort, retention, and LTV questions your e-commerce data can answer - across every store and channel.
Try it with any company domain — no signup required.
Step 5: Materialize for Performance
As your order volume grows, you don't want to recalculate cohorts on every dashboard load.
Ask Fi: "Create a materialized table from the cohort query that refreshes daily."
Fi sets up materialized tables in Definite's semantic layer (powered by Cube) that pre-aggregate the data:
| Materialized Table | What It Contains |
|---|---|
customer_cohorts_mat | Cohort metrics by brand, month, and months since first order |
cohort_ltv_summary_mat | Pre-aggregated LTV at 3, 6, 12, and 24 month horizons |
These refresh automatically on schedule. Dashboard queries hit the pre-aggregated tables, so they load in seconds.
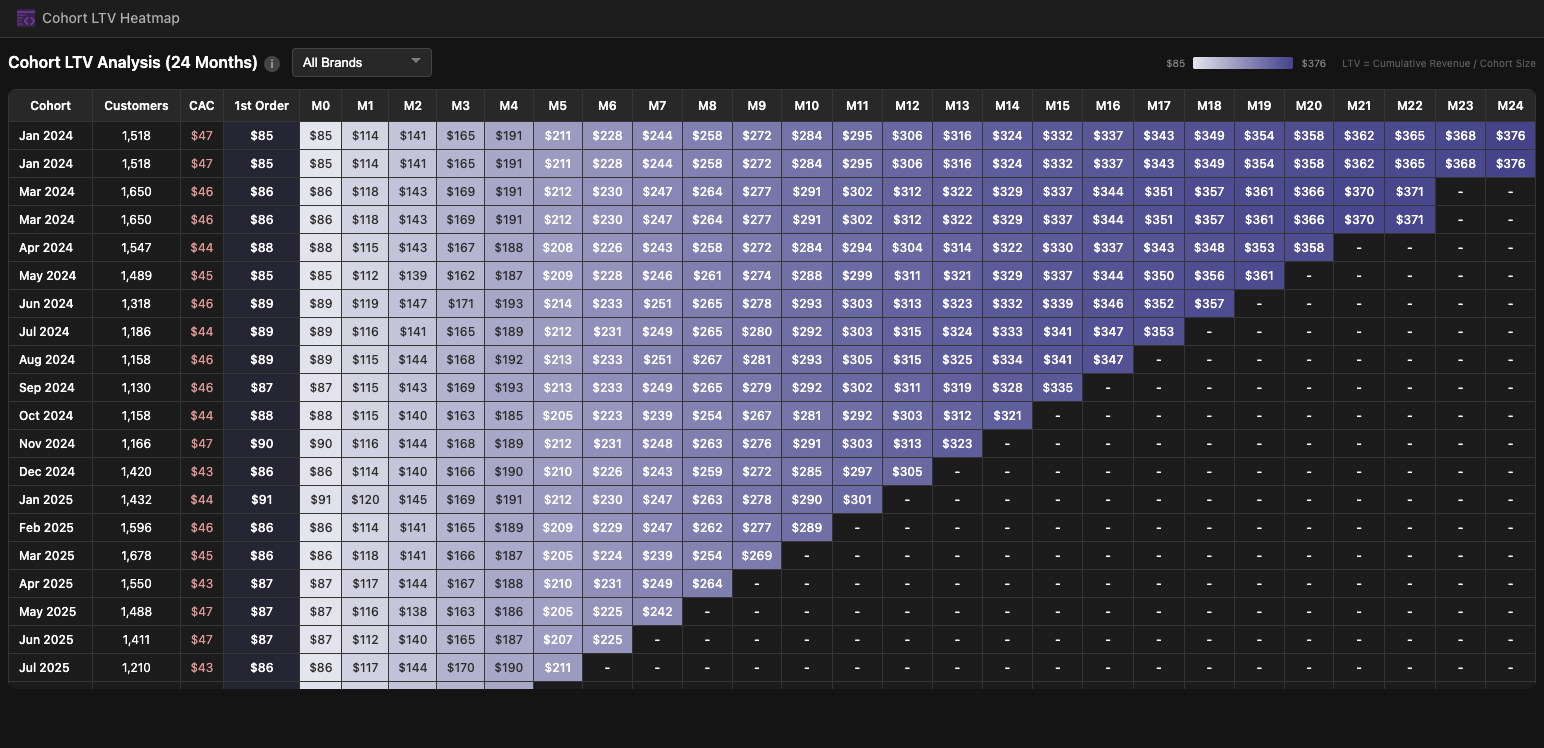
Step 6: Build the Heatmap
Standard chart types (bar, line, scatter) can't render a cohort heatmap. Definite supports custom HTML tiles with embedded JavaScript, which means you can build fully interactive visualizations.
Ask Fi: "Build an interactive cohort LTV heatmap with a purple color gradient and an average row at the bottom."
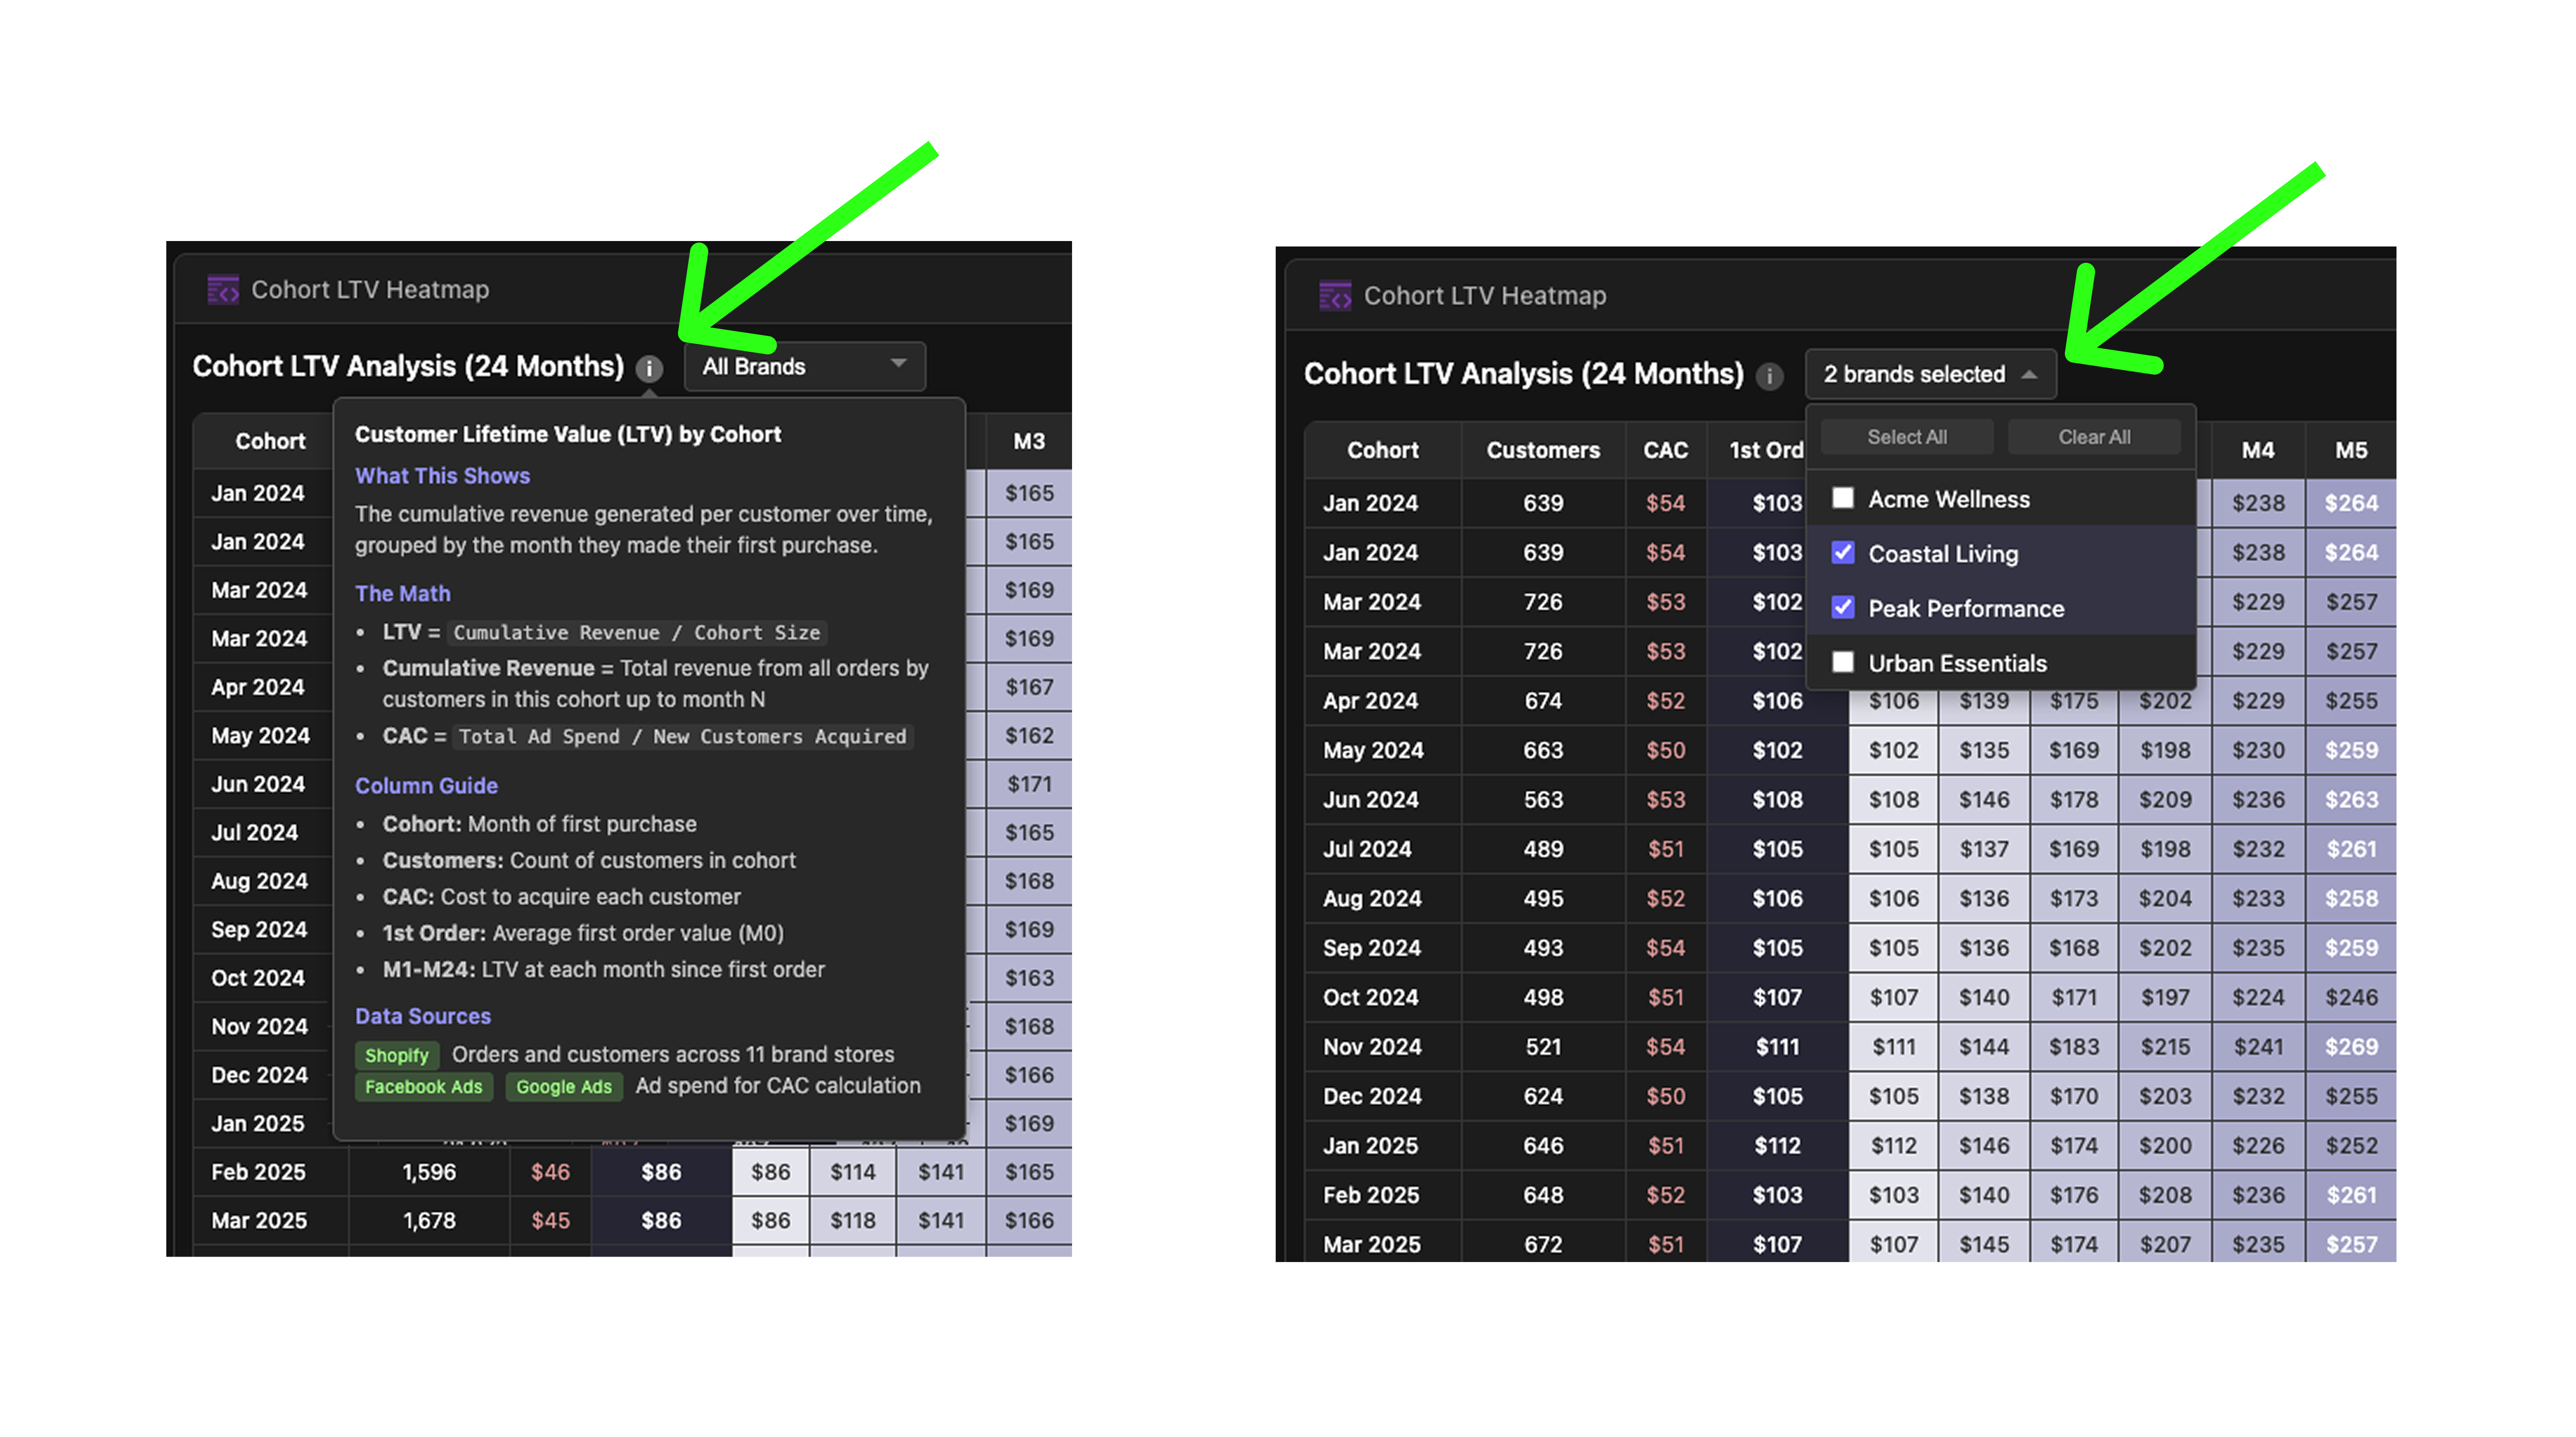
Fi builds an HTML tile that renders as a table where:
- Rows = cohort months (when customers made their first purchase)
- Columns = months since first purchase (M0, M1, M2, ... M24)
- Cell values = LTV at that point
- Cell colors = purple gradient from low LTV (light) to high LTV (dark)
Key interactive features:
- Average row: Shows the average LTV across all visible cohorts at each month
- Color legend: Dynamic min/max scale that updates as data changes
- Hover tooltips: See exact values on any cell
- Brand filtering (multi-store): If you have multiple brands, a dropdown lets you filter to specific stores or view all brands aggregated with cohort-size-weighted averages
Step 7: Add LTV KPI Tiles
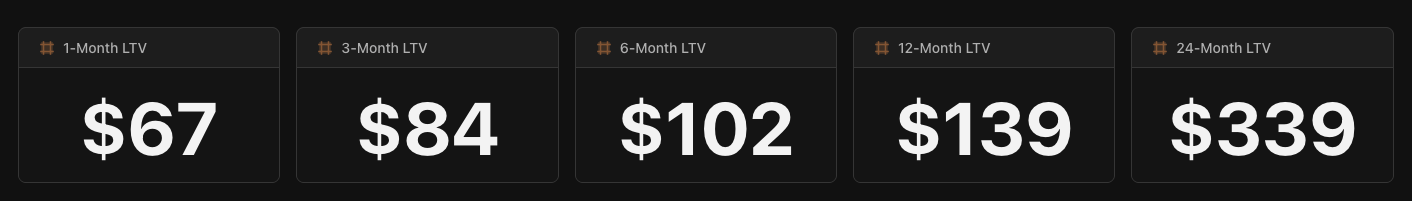
Ask Fi: "Add KPI tiles for 1-month, 3-month, 6-month, 12-month, and 24-month LTV."
Fi adds milestone KPIs so you can see blended LTV at a glance without scanning the full heatmap.
Step 8: Ask Fi Anything
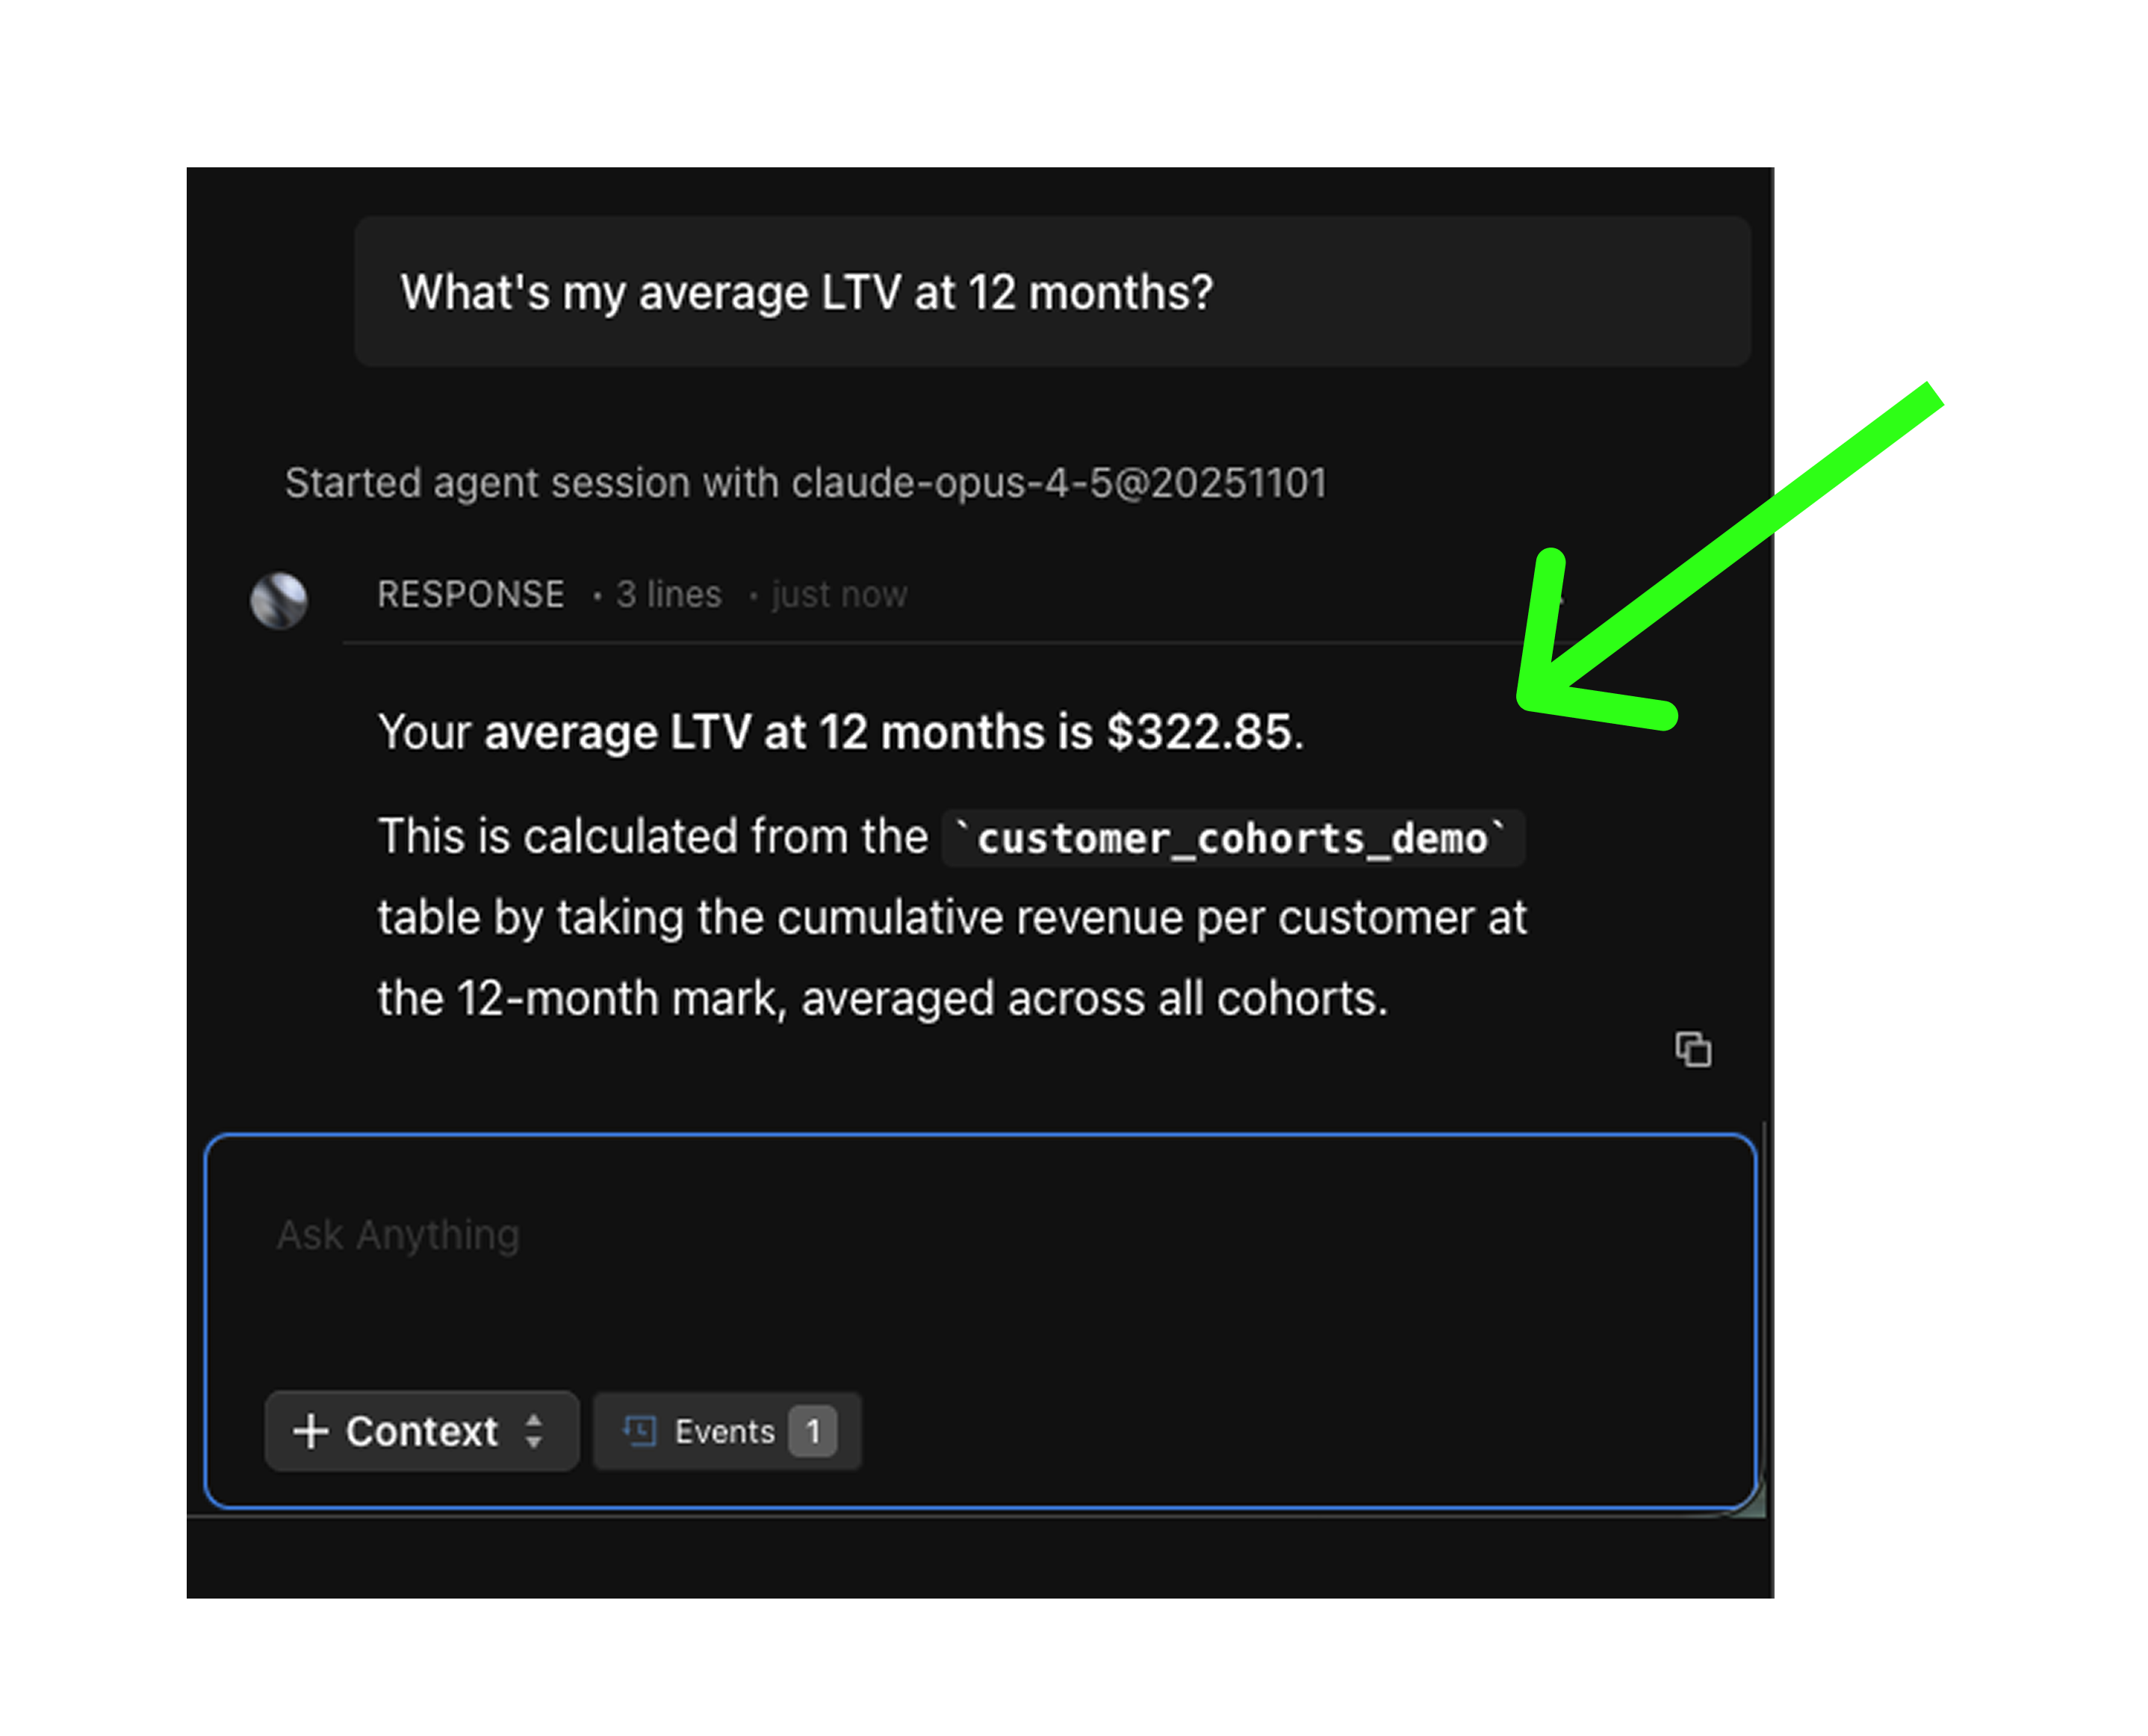
As you've seen in every step above, Fi can handle the heavy lifting. But it doesn't stop at building the dashboard. Once your cohort data is in place, Fi becomes your ongoing analytics layer. Ask it ad hoc questions anytime:
- "What's my 12-month LTV?"
- "What's our blended CAC this quarter?"
- "Show me retention rate for the January 2025 cohort"
- "When does the average customer pay back their CAC?"
- "Which brand has the highest repeat purchase rate?" (multi-store)
Fi understands the semantic model, writes the query, and returns the answer with a chart. No SQL required.
What You Get
| Component | What It Does |
|---|---|
| Shopify Order Sync | Your store data syncs to a managed data warehouse automatically |
| Cohort LTV Heatmap | Interactive heatmap with 24-month LTV progression |
| CAC Integration | Facebook Ads + Google Ads spend joined for payback analysis |
| Materialized Tables | Pre-aggregated data for fast dashboard loads |
| LTV KPIs | LTV at 1, 3, 6, 12, 24 month milestones at a glance |
| Multi-Store Support | Add more stores anytime, with brand filtering and weighted aggregation |
| AI Queries (Fi) | Ask questions in plain English, no SQL required |
Cost Comparison
| Solution | Annual Cost (1 store) | Annual Cost (10 stores) |
|---|---|---|
| Lifetimely | $3,600 | $36,000 |
| RetentionX | $6,000 | $60,000 |
| Triple Whale | $2,148-$8,988 | $21,480-$89,880 |
| Fivetran + Snowflake + dbt + Looker | $15,000-$50,000 | $15,000-$50,000 |
| Spreadsheets | Free (hours of manual work) | Free (even more hours) |
| Definite | Starting at $250/month ($3,000/year) | Same price (all stores included) |
Who Is This For?
- DTC brands that want to replace Lifetimely or similar SaaS tools with cohort analytics they own and can customize
- Performance marketing teams who need to calculate payback periods by joining LTV with Facebook Ads and Google Ads CAC
- Finance and strategy teams who use cohort data for revenue forecasting, marketing budget allocation, and board reporting
- Multi-brand operators running multiple Shopify stores who need portfolio-level LTV visibility without per-store SaaS fees
Whether you have one store or twenty, if you're paying for a cohort tool that can't blend in ad spend, or building LTV spreadsheets by hand, this is worth exploring. For unified reporting across multiple stores, see how to build multi-Shopify analytics.
Get Started
Connect your Shopify store and ad accounts, build cohort models, and get interactive LTV heatmaps in one platform.
- Start free: definite.app/signup
- Read the docs: docs.definite.app
- Questions? Email hello@definite.app