How Much Does a B2B SaaS Data Stack Cost: A Complete Guide

The Real Cost Isn't What You Think
When most B2B SaaS companies budget for analytics, they add up the obvious line items: Fivetran for ETL, Snowflake for storage, Tableau for dashboards. Maybe $2,000–$5,000 a month. Manageable.
Then they wonder why, two years later, they're spending $400,000 a month and still don't trust their churn numbers.
The problem isn't the tools. It's what the tools require.
Building a "modern data stack" means choosing to take on a coordination problem, not just a technology problem. Every connector you add is a pipeline to maintain. Every dashboard is a definition to govern. Every new hire spends their first month learning where the data lives... and where it breaks.
The "best practice" of assembling a modern data stack is also why most companies don't trust their own data.
This guide breaks down what a B2B SaaS data stack actually costs—visible spend, hidden multipliers, and the people required to keep it all working. We'll walk through a realistic growth scenario from 50 to 500 employees, showing how costs compound at each stage.
By the end, you'll understand:
- Why your data team grows faster than your company
- Where the money actually goes (spoiler: it's not the warehouse)
- What to budget at each growth stage
- Whether there's a better path
The B2B SaaS Data Profile
Before we get into costs, let's establish what a typical B2B SaaS company needs from their data stack.
Typical Data Sources
A growth-stage B2B SaaS company usually connects:
- Product database (Postgres, MySQL): user accounts, feature usage, application state
- Billing (Stripe, Chargebee): subscriptions, invoices, revenue
- CRM (HubSpot, Salesforce): leads, opportunities, customer records
- Marketing (Google Ads, LinkedIn Ads, Segment): campaigns, attribution, events
- Support (Intercom, Zendesk): tickets, conversations, satisfaction scores
- Product analytics (Mixpanel, Amplitude, GA4): funnels, retention, behavioral data
- Finance/ERP (QuickBooks, NetSuite): GL, AP/AR, financial reporting
Each of these is a pipeline you'll maintain, reconcile, and govern. Most companies start with 4–5 sources and grow to 10–15 by the time they hit 300 employees.
Analytics Types & Use Cases
| Analytics Type | Example Use Cases | Data Demands |
|---|---|---|
| Revenue/Finance | MRR, churn, cohort analysis, LTV (investor reporting) | High accuracy, governed metrics |
| Product | Feature adoption, funnels, retention | High volume, behavioral data |
| Marketing | Attribution, CAC, campaign ROI | Multi-source joins |
| Operations | Support SLAs, CSAT, response times | Near-real-time reliability |
Data Culture Spectrum
Your analytics intensity dramatically affects costs:
- Light: Occasional reports, executive dashboard, monthly reviews
- Typical: Weekly KPI tracking, self-serve exploration, team dashboards
- Heavy: Daily ad-hoc analysis, embedded analytics in your product, operational automation, AI/ML readiness
Here's the catch: each new use case adds dependencies across tools. Coordination overhead scales faster than your dashboard count.
Understanding Your Cost Drivers
Three factors determine roughly 80% of your data stack spend. Understanding how they interact is the difference between a reasonable budget and a runaway expense.
1. Data Sources (Connector Count & Complexity)
Every connector you add drives costs across multiple dimensions:
- ETL spend: Per-connector MAR (Monthly Active Rows) fees
- Storage: More data = more warehouse costs
- Modeling work: Each source needs transformations (and transformations need compute)
- Maintenance: Schema changes, API updates, sync failures
Not all connectors are equal. Database replication (Postgres) behaves differently than SaaS APIs (Salesforce) or event streams (Segment). Complexity varies.
The compounding effect: Our models show that moving from 6 to 11 connectors doesn't increase maintenance linearly—it adds roughly 40% more coordination and reconciliation burden. Adding your 10th connector doesn't cost 10% more. It can cost 40% more in people time.
Mental model: Connectors × Complexity Factor → Infrastructure + Ops Load
2. Company Size
Company size drives:
- BI seat counts: More people asking questions
- Query concurrency: More simultaneous requests
- Warehouse usage: More compute, more storage
- MAR volume: Larger customer base = more rows
- Governance needs: More people = more definitions to align
A 500-person company doesn't have 10× the data needs of a 50-person company. They have 10× the data needs plus 5× the governance requirements.
Mental model: Employees → Users → Query Load → Compute + Storage
3. Data Culture & Usage Demands
Light, typical, or heavy intensity changes how many questions get asked and how often metrics are stressed.
Heavy usage increases warehouse compute. It also increases the risk of semantic drift—when different teams define the same metric differently. Without governance, "churn rate" becomes three different numbers depending on who you ask.
AI readiness adds another layer. If you want AI-driven analytics, you need:
- A governed foundation (consistent metrics)
- A configurable system where AI can act (not just query)
Model It Instead of Guessing
These three factors interact in non-obvious ways. Rather than guess, use our calculator to model your specific situation:
Calculate Your B2B SaaS Data Stack TCO →
The Cost Components: What You're Actually Paying For
A data stack isn't a single purchase. It's an ongoing operating commitment. Here's what each layer costs—and how they compound.
Technology Costs (The Visible Spend)
Data Ingestion (ETL)
Pricing model: Per-connector, MAR-tiered (e.g., Fivetran) or row-based (e.g., Stitch)
What drives cost: More connectors → more MAR → higher ETL fees + downstream storage/compute
Typical range for B2B SaaS: $20–$500/month at foundation stage, scaling to $5,000–$9,000/month at 300+ employees with 10+ high-volume connectors. For cost-effective alternatives to Fivetran, see our guide to Fivetran alternatives.
Data Warehouse
Pricing model: Compute + storage (varies by vendor—BigQuery, Snowflake, Redshift)
What drives cost: ETL volume + BI queries → compute growth
Hidden trap: Warehouse costs are usage-sensitive. They grow faster than teams expect because every new dashboard, every ad-hoc query, every automated report adds compute. (For a vendor-by-vendor breakdown, see our cloud data warehouse cost comparison.) Snowflake's credit-based pricing can be particularly unpredictable—see our guide to understanding Snowflake pricing for details. For a detailed breakdown of warehouse options for startups, including cost comparisons, see our comprehensive guide.
Typical range for B2B SaaS: $150–$700/month at foundation, scaling to $750–$3,000/month at scale
BI & Visualization
Pricing model: Per-seat (Tableau, Power BI) or platform fee (Looker)
What drives cost: More users → more warehouse queries → higher compute
Perverse incentive: Seat-based pricing pushes teams to restrict access. The opposite of self-service analytics.
Typical range for B2B SaaS: $800–$2,100/month depending on seat count and tier
Transformation Layer (dbt)
Pricing model: Seats + model runs
What drives cost: More transformation logic → more compute → more orchestration complexity
Typical range for B2B SaaS: $300–$1,200/month depending on team size
The AI Question
Many teams bolt on AI copilots or "chat with your data" layers. But AI-on-top fails when the foundation is fragmented. AI amplifies semantic drift—it doesn't fix it.
If your warehouse has three definitions of churn, AI will confidently give you the wrong answer faster.
People Costs (The Hidden Multiplier)
This is where the real money goes.
Technology costs are visible on invoices. People costs are buried in salaries, hiring timelines, and opportunity cost.
The Data Team Capacity Model
| Role | Monthly Loaded Cost | What They Do |
|---|---|---|
| Data Analyst | $13,500–$18,000 | Reporting, dashboards, ad-hoc analysis |
| Data Engineer | $15,000–$25,000 | Pipeline maintenance, transformations, infrastructure |
A data engineer's job isn't just building pipelines. It's coordinating across ETL, warehouse, transformation, and BI layers. Each additional tool adds coordination overhead. For startups that need data expertise without full-time hires, fractional data teams can provide flexible capacity.
The Employment Reality
- <0.5 FTE need: You'll use fractional/contractor help. Expect 1.3–1.5× the FTE hourly rate.
- 0.5–1.5 FTE need: Hybrid model. One FTE + fractional for coverage/spikes.
- >1.5 FTE need: Time to hire. But you'll still need fractional coverage during ramp-up.
The question isn't whether you need a data team. It's whether you want to manage one.
Reality check: Most companies understaff their data teams relative to the demands placed on them. A recent survey of data engineers revealed massive variance in staffing levels—and a common theme of being "stretched too thin." One data lead at a 250-300 person company put it perfectly: "I feel thin. Like butter scraped over too much bread."
Setup & Migration Costs (The One-Time Tax That Repeats)
Implementation includes:
- Connector configuration
- Data modeling (the semantic layer problem)
- Dashboard and report building
- User training
At loaded salaries, a 10-week implementation costs $40,000–$60,000 in people time alone.
Here's what most vendors won't tell you: The setup cost isn't one-time. Most companies rebuild their stack every 2–3 years as they outgrow their architecture.
The Compounding Effect
| You Add... | Which Increases... | And Also... |
|---|---|---|
| More data sources | ETL spend | Storage, modeling work, engineering time |
| More users | BI seats | Warehouse compute, analyst support load |
| More transformations | dbt/model runs | Compute, orchestration complexity |
| More sophistication | All of the above | Governance requirements, rebuild risk |
In a fragmented stack, costs don't add—they multiply. Every layer depends on every other layer. Every change propagates across the system. The fragmentation itself is what drives people costs—someone has to glue it all together.
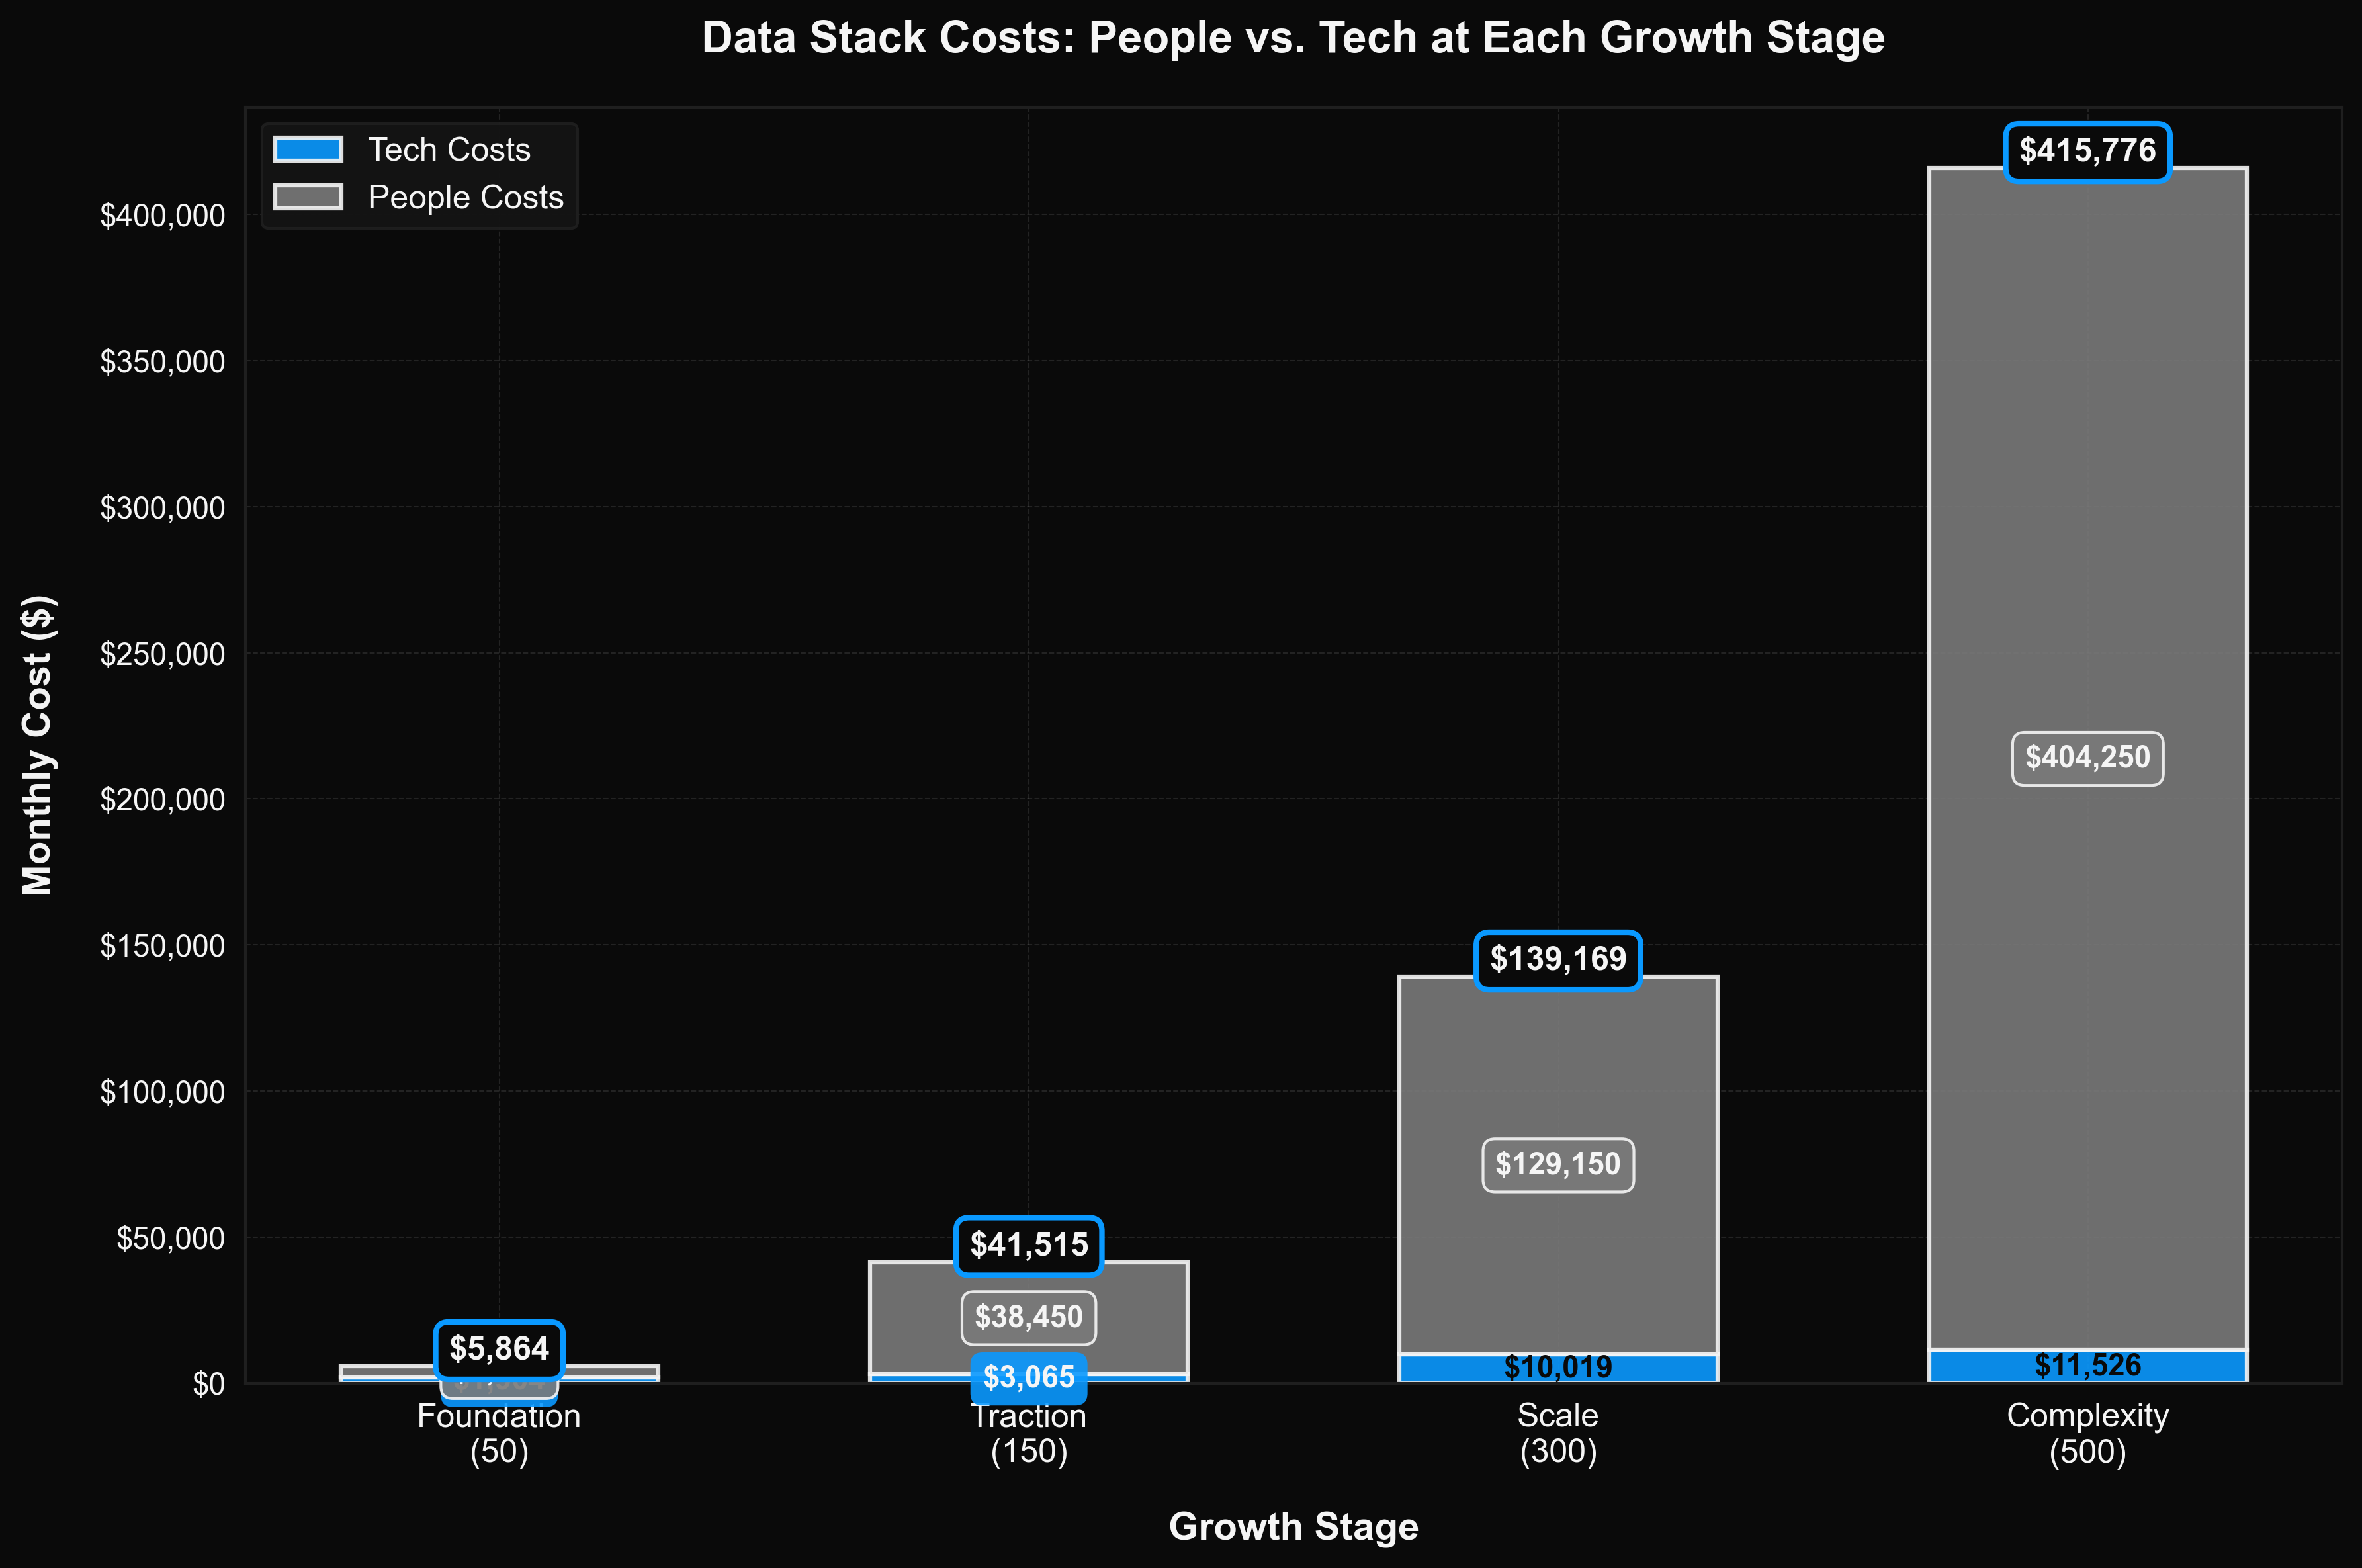
Growth in Action: From 50 to 500 Employees
Let's follow a realistic B2B SaaS company through four growth stages. These numbers are generated from our TCO model using current vendor pricing (2026 Q1).
Stage 1: Foundation (50 employees)
Profile: 4 connectors (Postgres, Stripe, HubSpot, Google Ads) · Low BI intensity
| Category | Low | Medium | High |
|---|---|---|---|
| ETL | $14 | $20 | $26 |
| Warehouse | $155 | $330 | $690 |
| BI Licensing | $786 | $1,254 | $2,115 |
| Transformations | $300 | $300 | $300 |
| Tech Subtotal | $1,255 | $1,904 | $3,131 |
| Data Team (People) | $3,960 | $3,960 | $3,960 |
| Total | $5,215 | $5,864 | $7,091 |
People requirement: ~0.25 FTE (fractional analyst/engineer hybrid)
At this stage, the stack feels manageable. One person can keep things running. The ETL bill is negligible. The warehouse barely registers.
But here's the trap: The architecture decisions you're making now—which warehouse, which BI tool, how you model metrics—will constrain everything that follows. Be wary of a junior engineer making these calls alone.
Stage 2: Traction (150 employees)
Profile: 7 connectors (+Intercom, +Salesforce, +LinkedIn Ads) · Typical BI intensity
| Category | Low | Medium | High |
|---|---|---|---|
| ETL | $498 | $711 | $924 |
| Warehouse | $290 | $600 | $1,350 |
| BI Licensing | $786 | $1,254 | $2,115 |
| Transformations | $500 | $500 | $500 |
| Tech Subtotal | $2,074 | $3,065 | $4,889 |
| Data Team (People) | $38,450 | $38,450 | $38,450 |
| Total | $40,524 | $41,515 | $43,339 |
People requirement: ~2–3 FTE (blended analysts + engineers)
Reality check: Real-world data teams at this stage typically have 4–6 people (manager, 2 data engineers, 1–2 analysts, maybe a junior). Our numbers represent the capacity requirement to keep a fragmented stack running—many companies understaff this and pay the price in broken pipelines and burned-out teams.
The inflection point: This is where the coordination tax becomes visible.
You're adding a second data hire, but they spend 40% of their time maintaining what the first person built—not creating new value. Sync failures. Schema changes. "Why doesn't this number match?"
First rebuild warning: Many companies hit their first "we need to redo the data model" moment here. The shortcuts from Stage 1 are now technical debt. The quick-and-dirty dbt models don't scale. The metric definitions aren't documented.
Notice the shift: tech costs went from $1,900/month to $3,000/month (1.6×). People costs went from $4,000/month to $38,000/month (9.5×).
Stage 3: Scale (300 employees)
Profile: 10 connectors (+Zendesk, +Mixpanel, +GA4) · High BI intensity
| Category | Low | Medium | High |
|---|---|---|---|
| ETL | $5,442 | $6,465 | $7,386 |
| Warehouse | $740 | $1,500 | $3,030 |
| BI Licensing | $786 | $1,254 | $2,115 |
| Transformations | $800 | $800 | $800 |
| Tech Subtotal | $7,768 | $10,019 | $13,331 |
| Data Team (People) | $129,150 | $129,150 | $129,150 |
| Total | $136,918 | $139,169 | $142,481 |
People requirement: ~7–8 FTE (full data team with specialization)
Reality check: When we looked at actual data teams at 300-person companies, we found:
- One B2B fintech: "~300 people... two data engineers and one team lead" (described as "the smallest team I've worked for")
- Multiple 250-300 person companies: 4–7 people, with most reporting they're understaffed
- One team with 7 people serving 250-300 employees called it "butter scraped over too much bread"
Our model shows what you need to operate a traditional stack effectively—not what companies typically budget for. The gap between capacity and staffing is why dashboards break, pipelines fail, and data teams burn out.
The governance crisis: By now, you have multiple people building reports from the same data with different definitions.
"What's our churn rate?" Three answers, depending on who you ask.
You need a semantic layer—a single source of truth for metric definitions. But retrofitting governance onto a fragmented stack is painful. It's essentially a rewrite. Learn more about what a semantic layer is and why it matters for consistent analytics.
Second rebuild: Many companies migrate warehouses or BI tools at this stage. The "flexibility" of the original stack has become rigidity. You're locked into choices made when you had 50 employees.
Stage 4: Complexity (500 employees)
Profile: 14 connectors (+Segment, +NetSuite, +Jira, +QuickBooks) · High BI intensity
| Category | Low | Medium | High |
|---|---|---|---|
| ETL | $6,296 | $7,572 | $8,847 |
| Warehouse | $740 | $1,500 | $3,030 |
| BI Licensing | $786 | $1,254 | $2,115 |
| Transformations | $1,200 | $1,200 | $1,200 |
| Tech Subtotal | $9,022 | $11,526 | $15,192 |
| Data Team (People) | $404,250 | $404,250 | $404,250 |
| Total | $413,272 | $415,776 | $419,442 |
People requirement: ~24–25 FTE (nearly 5% of company)
Reality check: This sounds high, but it's not uncommon at scale. From the same survey: a 400-person company reported "3 Data Engineers, a couple Analysts and a Director" (6 people)—far below capacity needs. A 500-person company had just 1 data person. Both felt the pain.
According to databenchmarks.com's analysis of 100 tech companies, companies that properly staff data operations at this scale typically have 15–30 people across data engineering, analytics, and data science teams—which aligns closely with our capacity model.
The AI readiness question: Leadership wants AI-driven analytics. Predictive churn. Automated anomaly detection. Natural language queries.
But your current stack is read-only. AI can query the warehouse, but it can't act. It can't update models, create dashboards, or trigger workflows based on what it finds.
You're being asked to add AI on top of a foundation that was never designed for it. The result? Another layer in the stack. Another integration to maintain. Another point of failure.
The Growth Summary
| Stage | Employees | Connectors | Traditional (med) | Tech Only | People % |
|---|---|---|---|---|---|
| Foundation | 50 | 4 | $5,864/mo | $1,904/mo | 68% |
| Traction | 150 | 7 | $41,515/mo | $3,065/mo | 93% |
| Scale | 300 | 10 | $139,169/mo | $10,019/mo | 93% |
| Complexity | 500 | 14 | $415,776/mo | $11,526/mo | 97% |
The pattern is clear: Technology costs scale linearly. People costs scale exponentially. By the time you hit scale, 93%+ of your data stack spend is people.
Our model is based on real-world capacity requirements validated against industry benchmarks from 100 tech companies and hands-on reports from data teams in production environments.
The cost of a data stack isn't what you pay this month. It's the cumulative cost of building, operating, and rebuilding a fragmented system as your needs evolve. You're not paying for the tools—you're paying for the people to integrate them.
Most companies don't budget for the rebuilds. And they definitely don't budget for proper staffing—which is why so many data teams report being chronically understaffed while leadership wonders why dashboards take weeks to build.
A Different Path: What If You Didn't Have to Build?
Everything above assumes you're taking the traditional approach: assemble tools, hire people, coordinate across layers, rebuild when you outgrow it.
But there's another way.
The Core Problem with Building a Modern Data Stack
The modern data stack is positioned as best practice. Fivetran + Snowflake + dbt + Looker. Best-in-class components. Maximum flexibility.
But "maximum flexibility" is another way of saying "maximum coordination burden." Each tool solves one problem. The fragmentation creates another: you need people to make them work together.
The three failure modes:
-
Long time to value: 4–14 weeks to first useful dashboard. Months to reliable metrics.
-
High people cost: Every tool needs someone to operate it. Every integration needs someone to maintain it. Every discrepancy needs someone to debug it.
-
Constant rebuilds: The architecture that worked at 50 employees breaks at 150. The modeling approach that worked at 150 needs a rewrite at 300.
The AI problem: Most companies now want AI-driven analytics. But AI layered on a fragmented, read-only stack just exposes the weaknesses underneath. AI amplifies semantic drift. It doesn't fix it.
What an All-in-One Platform Looks Like
Definite takes a different approach:
-
Single system: Ingestion, storage, transformations, modeling, visualization, and AI—all native. Nothing to glue together. This is what a modern data platform looks like—everything integrated from day one.
-
Governed by design: The semantic layer isn't optional. Every metric has one definition. Everyone sees the same numbers.
-
AI that acts: Not read-only queries. An AI agent (Fi) that can modify integrations, update models, create dashboards, and trigger workflows.
-
Days, not months: Most customers have production dashboards in under 7 days. One Series A SaaS company cut their analytics spend from $2,400/month to $250/month after consolidating onto Definite, and a 40-person e-commerce team went from 15-second dashboard loads to sub-second queries.
The Math
Definite pricing:
- Platform base: $250/month
- Per connector: $700/month
- Optional DTaaS (Data Team as a Service): $5,000/month
- Includes: Unlimited BI seats, AI analyst, storage, semantic layer, maintenance
| Stage | Traditional (med) | Definite + DTaaS | Savings |
|---|---|---|---|
| Foundation (50) | $5,864/mo | $8,050/mo | -37%* |
| Traction (150) | $41,515/mo | $10,150/mo | 76% |
| Scale (300) | $139,169/mo | $12,250/mo | 91% |
| Complexity (500) | $415,776/mo | $15,050/mo | 96% |
*At Foundation stage, Definite + DTaaS costs more than a fractional-only approach. But it eliminates rebuild risk and delivers governed analytics from day one. You're paying for the platform you'll need at 150 employees—not the one you'll outgrow.
The key insight: Traditional TCO is dominated by people costs (90%+ at scale). Definite's flat pricing + optional DTaaS replaces the coordination overhead of a multi-tool stack.
Who This Is For
Definite isn't for everyone. It's for:
- Leaders accountable for performance who can't wait months for answers
- Teams under pressure to move fast without building infrastructure
- Companies pushing toward AI-driven decisions who need a future-proof foundation
- Organizations that can't afford fragile, human-dependent data systems
If you're evaluating whether to build a data stack or get started with answers immediately, we'd love to show you how Definite works. For startups considering specific warehouse alternatives, see our Snowflake alternatives comparison or our guide to Databricks alternatives. And if you want to understand how AI is changing data analysis, we cover what works and what doesn't.
What's the real cost of not knowing?
Enter your domain and we'll show you the business questions your team can't answer today - and what it's costing you to keep guessing.
Try it with any company domain — no signup required.