Your Ad Platforms Can't Tell You Real ROAS. Shopify Can.
Every ecommerce brand running paid ads has two sets of numbers: the ROAS that Google and Meta report, and the ROAS that actually shows up in Shopify orders. The gap between them is not small. In this walkthrough, I connected Google Ads, Facebook Ads, and five Shopify stores to see what real blended ROAS looks like when you stop trusting the ad platforms to grade their own homework.
The Gap: 97% Over-Reporting
Here is what the ad platforms said about our five brands' combined performance:
- Google Ads reported: 3.2x ROAS
- Meta Ads reported: 4x ROAS
- Actual blended ROAS from Shopify: 1.9x
That is a 97% discrepancy between what the platforms claim and what the bank account reflects. The total ad spend across both platforms was roughly $214K. The revenue those ads supposedly drove, according to the platforms, was dramatically higher than what Shopify actually recorded.
This is not a bug. It is how ad platform attribution works by design.
Why Every Platform Inflates Its Own Numbers
Google and Meta both want credit for your conversions. They use different attribution models, different lookback windows, and different counting rules — all of which skew in their favor.
Meta's attribution model defaults to a 7-day click, 1-day view window. If someone sees your ad in their feed, does not click, then buys from a Google search three days later, Meta counts that as a Meta conversion. View-through attribution is the biggest culprit. Meta reported 4x ROAS across our brands, but a significant portion of those "conversions" were customers who would have purchased anyway.
Google's attribution model uses data-driven attribution by default, distributing credit across multiple touchpoints in the Google ecosystem. If a customer clicked a branded search ad before purchasing — even if they already knew your brand — Google takes credit. Google reported 3.2x, which looks more conservative than Meta until you realize it is still nearly double the actual number.
The double-counting problem is the worst part. When both platforms claim credit for the same purchase, your "total ROAS" on paper can be 2-3x higher than reality. One conversion, two platforms taking credit. Shopify only records each order once.
Brand-Level Breakdown: One Was Losing 60 Cents on Every Dollar
The aggregate 1.9x blended ROAS hides an even more important story at the brand level. When we broke the numbers down per brand, the variance was massive:
| Brand | Meta Reported | Google Reported | Actual (Shopify) | Verdict |
|---|---|---|---|---|
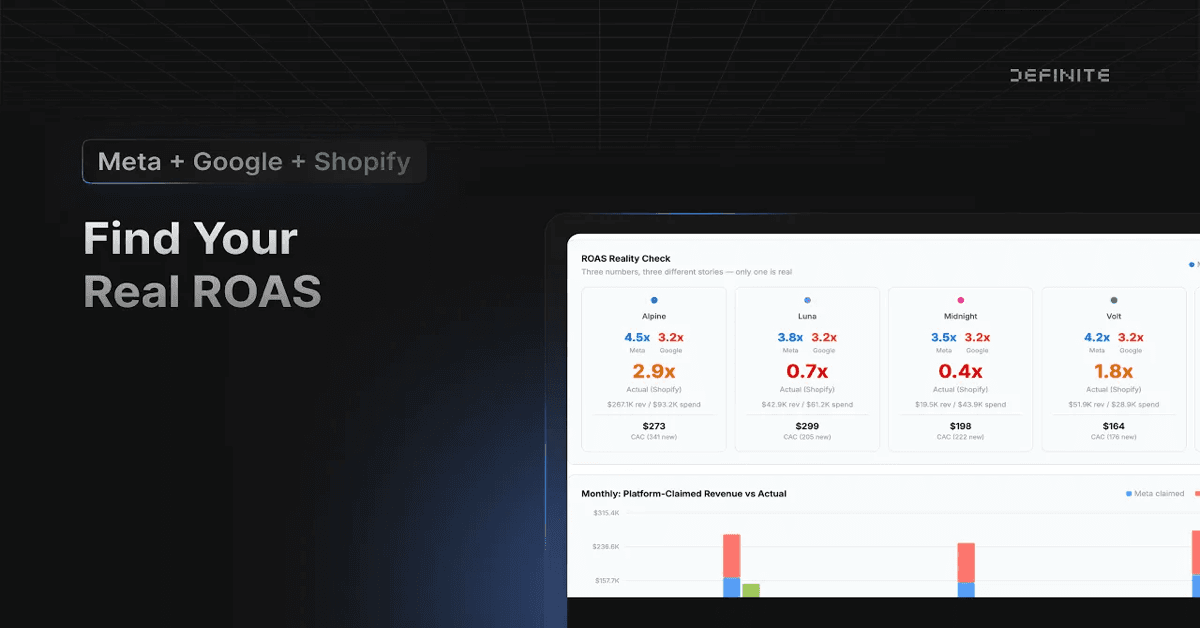
| Alpine | — | — | 2.9x | Profitable |
| Midnight | 3.5x | 3.2x | 0.4x | Losing money |
| Luna | — | — | — | Mid-range |
| Pawsome | — | — | — | Mid-range |
| Volt | — | — | — | Mid-range |
The standout: Midnight. Meta claimed 3.5x. Google claimed 3.2x. Actual ROAS from Shopify was 0.4x. For every dollar spent on ads, the brand was getting back 40 cents. That is not a rounding error — it is a brand actively burning cash while the ad platforms report healthy returns.
Without cross-referencing against Shopify, there is no way to catch this. The Midnight team would keep scaling spend because every signal from the ad platforms says it is working.
Alpine, on the other hand, was genuinely profitable at 2.9x. That is the kind of brand where you want to reallocate budget.
CAC Tells the Rest of the Story
ROAS alone does not capture profitability — it does not account for product margins, fulfillment costs, or customer lifetime value. That is where customer acquisition cost (CAC) becomes essential.
Here is what the actual CAC looked like across brands:
| Brand | CAC |
|---|---|
| Alpine | $273 |
| Luna | $299 |
| Midnight | $198 |
| Pawsome | $157 |
| Volt | $164 |
Midnight's $198 CAC looks appealing on the surface — it is the third lowest. But paired with a 0.4x ROAS, it means each acquired customer costs $198 and generates less than $198 in revenue before you even account for COGS and shipping. Low CAC with sub-1x ROAS is a trap.
Pawsome and Volt have the lowest CACs at $157 and $164, which makes them candidates for scaled spend — assuming their ROAS holds up as volume increases. Alpine's $273 CAC is the highest, but at 2.9x ROAS the unit economics work.
The takeaway: you need both numbers together. ROAS without CAC is incomplete. CAC without ROAS is blind.
What to Do When You Find an Unprofitable Brand
Discovering a brand at 0.4x ROAS creates an immediate question: shut off spend or fix the funnel?
The answer depends on the cause. A few places to look:
- Creative fatigue: If ad frequency is high and CTR is declining, the platform is showing the same ads to the same people. Fresh creative might restore performance.
- Audience mismatch: The platform's algorithm may be optimizing for clicks or add-to-carts rather than purchases that stick. Check your return rate for ad-acquired customers.
- AOV problem: If the average order value for ad-acquired customers is significantly lower than organic customers, the ads are attracting bargain hunters. No amount of ROAS optimization fixes a structural AOV gap.
- Margin structure: Some products simply cannot support paid acquisition. If your margins are 30% and your CAC is $198, you need a $660+ AOV to break even on the first purchase.
If none of those are fixable, the right move is to reallocate that budget to Alpine or whichever brand has proven unit economics — and invest the Midnight budget in organic channels instead.
The Manual Way vs. Having a System
There are two paths to getting these numbers.
The manual path: Export campaign data from Google Ads. Export campaign data from Meta Ads Manager. Export order data from each Shopify store. Open a spreadsheet. Match spend to revenue by date range. Pray that your UTM parameters are consistent. Repeat every week. For five brands across two platforms, this is a full day of work each time you want a current read.
The infrastructure path: Set up a data warehouse (Snowflake, BigQuery), connect an ETL tool (Fivetran, Stitch), build a transformation layer (dbt), add a BI tool (Looker, Tableau). Budget $2-5K/month in tooling before anyone writes a query. Maintain the pipelines when schemas change.
What I did in the video: I connected all seven data sources — two ad platforms and five Shopify stores — to Definite, then asked Fi to calculate real blended ROAS and CAC by brand. Fi pulled the actual Shopify revenue, matched it against combined ad spend, and built the dashboard. When I wanted hover tooltips showing the formula and data sources behind each metric, I asked for that too and it iterated on the visualization in real time. No spreadsheet. No warehouse. No pipeline maintenance.
The Metrics Your Ad Platforms Will Never Show You
Platform-reported ROAS is a marketing metric. Real blended ROAS is a finance metric. The difference between the two is the difference between feeling good about your ads and knowing whether they are actually making money.
If you are running ads across Google and Meta into multiple Shopify stores, the only source of truth for revenue is Shopify. The ad platforms will always over-report because their attribution models are designed to justify spend — not to give you an honest picture.
The brands that win are the ones that catch the Midnights early, double down on the Alpines, and stop making budget decisions based on numbers that are inflated by 97%.