How to See Real ROAS Across All Your Google Ads Accounts
Google Ads says every one of your accounts is returning roughly 3.2x on spend. That sounds great — until you check Shopify and realize one brand is barely breaking even at 1.19x while another is printing money at 7.68x. The uniform number Google reports masks what is actually happening at the brand level, and if you are making budget decisions based on it, you are probably misallocating spend.
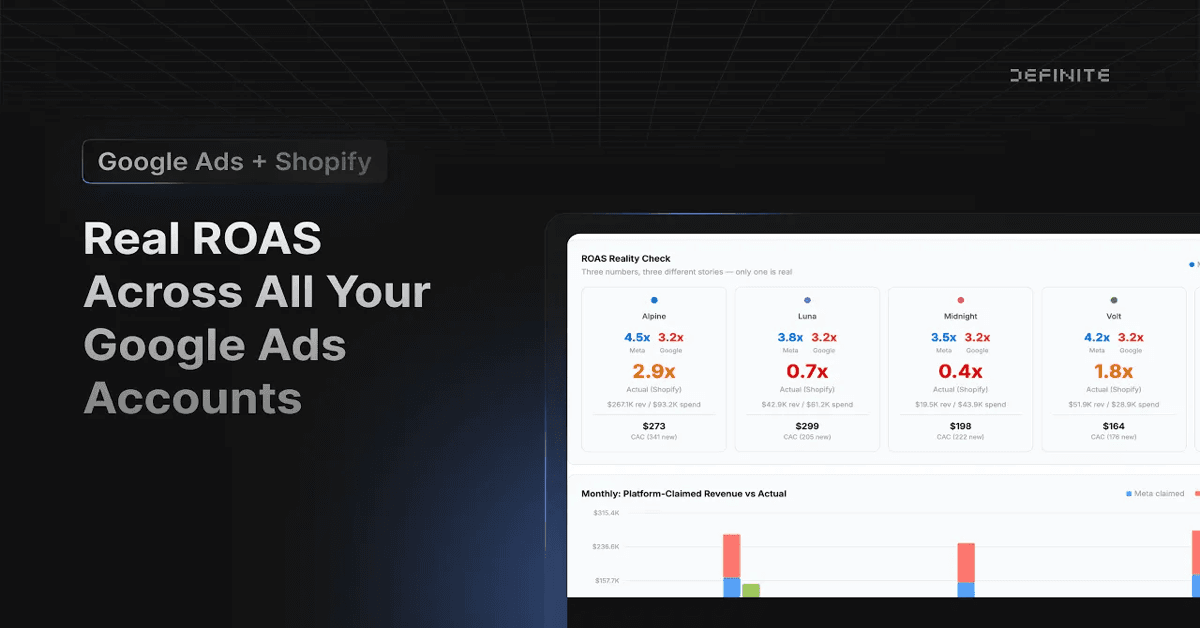
In the video above, we connect five Google Ads accounts and five Shopify stores, then build a cross-account dashboard that shows real ROAS (Shopify revenue divided by Google spend) next to Google's self-reported number. This post walks through what we found and why the gap matters.
Why Google's Reported ROAS Is Misleading
Google Ads reports ROAS as conversion value / cost. The conversion value comes from whatever you have configured in your Google Ads conversion tracking — typically a purchase event fired by a tag on your checkout confirmation page.
That number can diverge from actual revenue for several reasons:
- Attribution window mismatch. Google defaults to a 30-day click-through attribution window. If a customer clicks an ad, browses for two weeks, then buys, Google claims the conversion. Shopify records it as an organic or direct sale. Same revenue, counted differently.
- Cross-device and view-through inflation. Google attributes conversions to ad views (not just clicks) and models cross-device behavior. These modeled conversions inflate conversion value without corresponding to trackable purchase events in Shopify.
- Duplicate and returned orders. Google records the conversion when the tag fires. It does not subtract returns, cancellations, or duplicate events. Shopify's revenue reflects the final transaction state.
- Tag misconfiguration. If your Google tag fires on the wrong page, fires twice, or reports pre-tax vs. post-tax amounts differently than what Shopify records, the numbers drift further apart.
None of this means Google is lying. The platform is reporting exactly what its attribution model sees. But "what Google's model sees" and "what actually showed up as revenue in your store" are two different questions — and you need the second one to make budget decisions.
What We Found: $93K in Spend, Five Very Different Stories
Across five brands with a combined ~$93,000 in Google Ads spend year-to-date, the numbers told two completely different stories depending on where you looked.
Google's version: Every brand returned roughly 3.2x. The uniformity alone should raise a flag — five different brands, different price points, different audiences, all returning the same ratio?
Shopify's version:
| Brand | Google Spend | Google ROAS | Actual ROAS (Shopify Revenue / Google Spend) |
|---|---|---|---|
| Alpine | $12K | ~3.2x | 7.68x |
| Coastal | $22K | ~3.2x | 3.41x |
| Summit | $18K | ~3.2x | 2.05x |
| Bloom | $19K | ~3.2x | 1.87x |
| Midnight | $22K | ~3.2x | 1.19x |
Alpine was the standout — nearly 8x real return. Midnight was barely above breakeven. If you trusted Google's numbers, you would split budget evenly. If you looked at Shopify revenue, you would shift spend toward Alpine and investigate what is failing at Midnight.
Teams running multi-brand e-commerce make budget allocation decisions weekly. The source of truth for those decisions matters.
Why This Is Hard to Do Manually
The manual version of this analysis means exporting spend from each Google Ads account, pulling revenue from each Shopify store, mapping brand names between platforms (Google calls it "MCC - Alpine Outdoor," Shopify calls it "alpine-gear-store"), calculating actual ROAS, and repeating every week.
For five brands, this is tedious but survivable. For fifteen or fifty, it is a full-time job. And the spreadsheet breaks every time someone renames an account or adds a new brand.
The alternative is building a data pipeline: an ETL tool, a warehouse, a transformation layer, and a BI tool. That works, but you are managing four vendors and paying $15,000-$50,000 per year before you see your first chart. (For a deeper look at why the modern data stack approach fails, see our breakdown of what went wrong.)
How We Built the Dashboard in the Video
In the video, we used Definite to connect all five Google Ads accounts and all five Shopify stores, then asked Fi (Definite's AI agent) to build the cross-account ROAS dashboard.
The key steps:
- Connect data sources. Each Google Ads account and Shopify store connects as a separate integration. Data syncs automatically to a managed warehouse — no Snowflake or BigQuery to provision.
- Normalize brand names. A brand mapping table standardizes the different names each platform uses. This is the same approach we described in our guides on multi-store Shopify analytics and Google Ads MCC reporting.
- Ask Fi to build the dashboard. Rather than writing SQL or dragging chart widgets around, we described what we wanted: "Show me real ROAS from Shopify revenue next to Google's reported ROAS, broken down by brand." Fi built the dashboard, including the comparison table and bar charts.
- Iterate in real time. In the video, we also asked Fi to add hover tooltips showing exact dollar amounts. It modified the dashboard on the fly — no code changes, no re-deploys.
The entire setup took less time than it would take to export CSVs from five accounts and align them in a spreadsheet.
What to Do With This Data
Seeing the real numbers is only useful if you act on them. A few practical next steps:
- Reallocate budget toward high-actual-ROAS brands. If Alpine is returning 7.68x while Midnight returns 1.19x, test shifting spend and monitor whether Alpine's efficiency holds at higher volume.
- Investigate underperformers. Low actual ROAS does not always mean the ads are bad. It might mean the landing page is weak, the product margins are thin, or the audience targeting is off. The dashboard surfaces which brands to investigate — and once you know which brand to dig into, a cohort LTV analysis can reveal whether those customers are unprofitable long-term or just slow to convert.
- Stop trusting a single source for budget decisions. Google Ads is an advertising platform with an incentive to report favorable results. Shopify is a commerce platform that records what customers actually paid. Use both, but let Shopify settle the argument about what is real revenue.
- Track trends, not snapshots. A single month of ROAS data can mislead. Build the dashboard to show trailing 90-day or year-to-date trends so you can distinguish noise from signal.
The Bigger Picture
Google Ads is not unique here. Facebook, TikTok, and Amazon all have their own attribution models and their own incentives to report favorably. Any platform that grades its own homework should be cross-referenced with your actual revenue data.
The question is whether you do that cross-referencing in spreadsheets every week, invest in a warehouse and ETL pipeline, or use a platform that handles the plumbing so you can focus on the analysis. The video shows what the third option looks like in practice.