Supabase Analytics: Where Your Queries Should Actually Run

Can you run analytics directly on Supabase? Yes — your database is Postgres, and Postgres will execute any aggregation you throw at it. The real question is whether your production database is where those queries should run, and the answer is no: point a BI tool at the Postgres serving your app and you inherit RLS friction, pooler limits, JSONB-hostile charting, and analytical load on OLTP compute — and the fixes show up on your Supabase bill.
One disambiguation before anything else: if you searched "supabase analytics" looking for the platform's Logs & Analytics feature — API gateway latency, error spikes, Logflare — that's observability, and Supabase's own pages cover it well. This post is about the other thing: business analytics on the data in your Supabase database. Signups, activation, revenue, the dashboard your CEO keeps asking about.
The short version
- Query your Supabase Postgres directly for the first ten questions — the SQL editor is right there. It stops being the answer when queries recur, get heavy, or need data that isn't in Postgres.
- BI on production breaks in predictable ways: RLS, pooler limits, JSONB-hostile charting, and scan-heavy load on compute that's serving your app.
- The in-platform fixes cost real money: compute upgrades, or a read replica that roughly doubles your database spend.
- Even Supabase agrees Postgres isn't the analytics layer. Analytics Buckets — Iceberg-backed columnar storage — exist precisely because analytical workloads belong somewhere else.
- Don't overcorrect into a warehouse build. The right move is replicating into a lightweight columnar layer where app data can join the Stripe, CRM, and ad data your actual business questions require — without assembling a stack to get it.
The three things "Supabase analytics" can mean
| What it's called | What it actually is | Dashboards in the box? |
|---|---|---|
| Logs & Analytics | Logflare observability on your services | No |
| Analytics Buckets | Iceberg storage, bring your own engine | No |
| Business analytics | The dashboards and metrics you want | Not built in |
The first is operational telemetry — useful for debugging a slow endpoint, not for cohort revenue. The second is storage infrastructure, covered below. The third is what you came for, and Supabase doesn't ship it; the closest first-party pointer is a guide for connecting Metabase over the Postgres driver. The rest of this post is about the third one — and why the obvious way to get it is the wrong way.
Why BI on your production Postgres breaks
The default advice on this topic is "just connect Metabase (or Power BI, or Grafana) to your database." It works for an afternoon. Then it breaks, in four specific ways.
RLS wasn't designed for your analyst. Your schema enforces row-level security around auth.uid() and per-user policies — exactly right for the app, wrong for a BI service account that needs to scan everything. So you either grant a role that bypasses RLS (a security review you now own) or write analytics-shaped policies into your production auth model. Neither feels good, because neither is what RLS is for.
The connection path fights long-running queries. Supavisor's transaction mode is built for short-lived connections and doesn't support prepared statements, which BI tools lean on. Session mode or a direct connection works — but direct connections are IPv6 unless you pay for the IPv4 add-on, and either way you now have a dashboard tool holding long-lived connections against the database serving your app.
JSONB columns fight every charting tool. The flexible columns that made development fast are opaque to drag-and-drop BI. One team we worked with hit exactly this: product data in Supabase Postgres, key fields buried in JSONB, and the workaround was everyone on the team keeping a personal ChatGPT project to generate the SQL to unpack them. Five people, five slightly different extraction queries, five slightly different numbers.
The compute is the wrong shape. Your instance is row-oriented and tuned for transactional work — fast lookups, inserts, updates. Analytical queries scan and aggregate across large swaths of rows, which is the workload columnar engines exist for. Run them on the primary and they compete with live traffic for the same CPU and memory. Supabase's docs are explicit: use a read replica for complex analytical queries and reserve the primary for user-facing operations.
None of this is a knock on Supabase. It's an excellent application database doing exactly what an application database should. The mistake is asking it to also be the analytics layer.
What the in-place "fix" does to your Supabase bill
Suppose you ignore the architecture argument and make production analytics work anyway. The costs are concrete.
Path one: upgrade compute. Analytical load on the primary means bigger instances. Supabase compute add-ons run from $10/month (Micro) through $60 (Medium), $110 (Large), $210 (XL) and on up to $3,730 for a 16XL. Dashboards that get slow as the events table grows have a way of marching you up that ladder — and the upgrade serves your BI tool, not your users.
Path two: add a read replica. This is Supabase's recommended answer for analytical queries, and it genuinely fixes the contention. But read it as a line item: a replica runs the same compute size as your primary and bills for it separately — your plan's compute credits don't apply — plus disk at 1.25× the primary's size. In practice, a replica roughly doubles your database spend. And what you get for it is still single-source, OLTP-shaped analytics: the same row-store engine, the same JSONB friction, the same inability to see Stripe or your CRM. You've paid for a second copy of the wrong tool for the job.
That's the honest accounting for "just point a BI tool at it." It isn't free; it's a compute upgrade or a doubled bill, plus a security exception, in exchange for analytics that still can't answer cross-source questions.
Analytics Buckets: Supabase's own answer, and what it tells you
In 2025 Supabase shipped Analytics Buckets — object storage backed by Apache Iceberg, built for large analytical datasets. If you've been following the Iceberg and DuckDB-on-object-storage story, you'll recognize the architecture immediately: columnar data in open formats, queried by whatever engine speaks the Iceberg REST catalog.
Read the subtext. Supabase — the company with every incentive to tell you Postgres can do everything — built a separate columnar storage layer for analytics. That's the platform conceding the central point: production Postgres is not where analytical workloads belong.
Should you build on Buckets today? For most startups, not yet. The feature is early — Supabase's docs warn of rapid changes and possible breaking updates — and there's no query UI or dashboards in the box. The managed way to fill one now exists: Supabase ETL, a change-data-capture pipeline that replicates Postgres into Buckets or BigQuery — but it's in private alpha behind a request form, usage-priced, and replicates as-is (no transforms, and schema changes don't propagate). You can also query a bucket back from Postgres via foreign data wrappers, which is handy for an occasional current-vs-historical join and not a BI architecture. Outside the alpha, getting data in still means running your own PyIceberg or Spark pipeline — precisely the infrastructure project you're trying to avoid. And either way, what's in the bucket is still files: because Buckets speak the standard Iceberg REST catalog, an engine like Definite's can attach and read them directly — but you still need that engine, plus modeling and BI, before files become answers.
But the direction of travel matters. Supabase is building toward exactly the architecture this post recommends: replicate out of production Postgres into an open columnar layer, and run analytics there. The question isn't whether that's the right shape — Supabase just validated it. The question is whether you assemble that layer yourself or use one that already exists.
Your four real options
Option 1: The Supabase SQL editor
Right for the first ten questions. You write SQL, get an answer, export a CSV. It runs out of room when metrics recur (you're rewriting the same query), when queries get heavy (they're hitting production), or when the question involves Stripe or your CRM (that data isn't in this database at all).
Good for: exploration, one-off questions, the first month. Breaks when: metrics recur, queries get heavy, or questions cross sources.
Option 2: BI tool on your Postgres (plus the replica)
Metabase, Power BI, or similar, connected to your database. Fast first chart — and everything in the two sections above applies: RLS workarounds, connection friction, JSONB pain, and either analytical load on production or a replica that doubles your bill. After all of it, the tool is a visualization layer over one source; it draws very clean charts on top of inconsistent, single-source numbers. The problem isn't which BI tool — it's the layer it's pointed at.
If your questions genuinely live in one database, a replica plus Metabase is a defensible setup, and our guide to Postgres analytics options covers that path. Most teams' questions don't stay in one database for long.
Good for: a fast first dashboard when all your data really is in Postgres. Breaks when: questions cross sources, definitions need governing, or the replica invoice arrives.
Option 3: ETL everything to a warehouse
The classic answer: replicate Supabase, Stripe, and the rest into Snowflake or BigQuery with an ETL tool, model it with dbt, put a BI tool on top. This solves the multi-source problem — and it's the other failure mode for a startup on Supabase. It's three or four contracts, a pipeline you own, and a multi-week build before the first dashboard. You chose Supabase so you wouldn't have to run infrastructure; a warehouse build signs you up to run more of it. We've watched teams stall exactly here: analytics approved, weeks in, contracts signed, still no clean number. If you've outgrown Postgres for analytics and have a data team to own the result, the warehouse path is real. That's not the team this post is for.
Good for: data teams, many sources, large scale. Breaks when: you're a small team that wanted answers, not a platform to operate.
Option 4: Replicate into a lightweight columnar layer
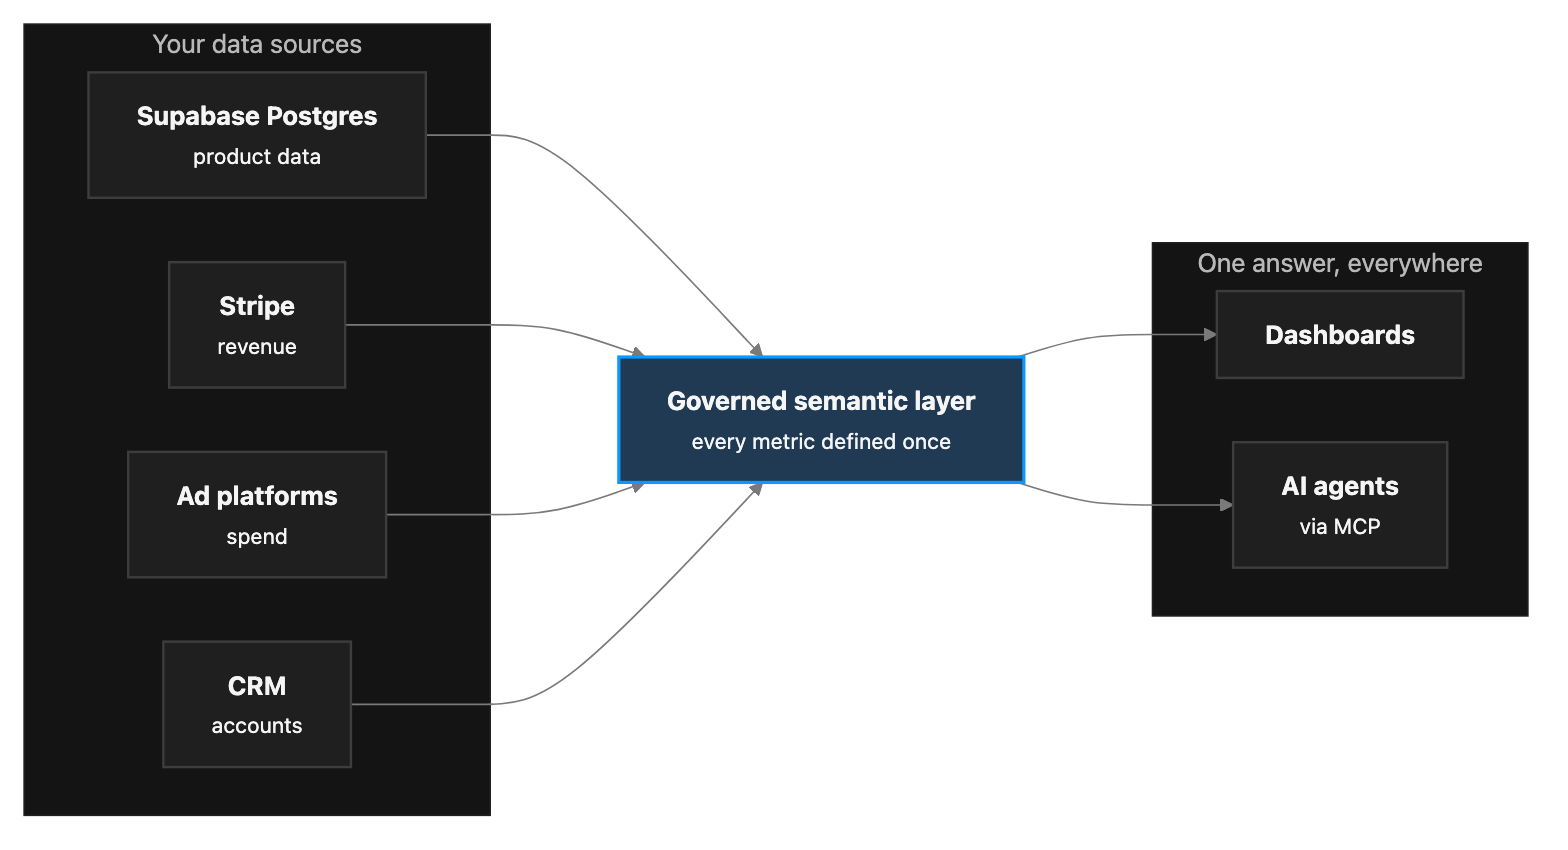
The architecture Supabase itself is building toward, available now without assembling it: replicate your Postgres into a DuckDB-shaped, Iceberg-compatible analytical store that also ingests your other sources, define your metrics once on top, and point dashboards, AI, and APIs at that governed layer.
This is what Definite is. It connects to your Supabase Postgres with read-only credentials and syncs on a schedule — an initial copy, then incremental pulls of changed rows, not the full-table aggregations a BI tool fires at production on every dashboard refresh — lands everything in an open lakehouse alongside Stripe, your CRM, and your ad platforms, and gives you a governed semantic layer where "active user" and "MRR" are defined once. Dashboards come from asking Fi or building by hand; agents and code get the same metrics over MCP and API. Honest tradeoffs: syncs are scheduled batches rather than a live stream, and hard-deleted rows aren't propagated yet (CDC support is on the roadmap) — if you hard-delete, lean on soft-delete flags or a periodic full refresh of those tables. In exchange there's no replication slot on your primary and nothing to babysit, and the analytical queries never touch your app's database. The store is open Parquet, Iceberg-interoperable, and can live in a bucket you own, so adopting it isn't a one-way door.
Good for: small teams that want governed, multi-source analytics in days, with no stack to run. Breaks when: you have a mature data team that wants to own every layer itself.
The four options, compared
| SQL editor | BI tool on Postgres | Warehouse + ETL + BI | Columnar layer (Definite) | |
|---|---|---|---|---|
| Joins Stripe / CRM / ads | No | No | Yes | Yes |
| Governed metric layer | No | No | If you build it | Built in |
| Production-DB impact | Heavy queries hit prod | Heavy queries hit prod, or pay for a replica | None after sync | Scheduled incremental reads only |
| Supabase bill impact | Compute upgrades as queries grow | Compute upgrades or ~2× (replica) | None, but new warehouse + ETL bills | None |
| Infrastructure you run | None | Replica + BI tool | Warehouse, pipelines, models | None |
| Data stays portable | Yes | Yes | Limited (proprietary store) | Yes — open Parquet / Iceberg |
| Agent / MCP ready | No | No | Depends | Yes |
| Time to first dashboard | Minutes (one-off) | An afternoon | Weeks to months | Days |
Your agents need the governed layer more than your dashboards do
If you're building on Supabase in 2026 you've probably already wired up MCP and started pointing agents at your data. This is where the governed-layer argument stops being abstract.
An agent writing freelance SQL against raw production tables is the JSONB-and-definitions problem at machine speed: it will eventually join the wrong thing and report a confident, wrong number. It also can't see Stripe or your CRM, so it answers cross-source questions from whatever's in Postgres and fills the gap with confidence. The fix is the same layer your dashboards need — metrics defined once over joined data, exposed to humans as dashboards and to agents over MCP, so both return the same answer because both read the same definition.
Where to start
If your questions genuinely live in one database and you're fine budgeting for a replica, a BI tool on Postgres is a defensible first step — go in with clear eyes about the bill and the RLS work. If you're staring at a warehouse project, it's almost certainly more than you need right now.
But the first real analytics question most founders get asked — revenue by signup cohort, CAC against usage, which flagged accounts churned — crosses Supabase, Stripe, your ad platforms, and your CRM in a single sentence. That question needs a layer where those sources come together, governed, off your production database. That's the case Definite was built for: connect your Supabase Postgres and your other sources, define the core metrics once, and have the first dashboard up in days — one team that had spent a month mid-warehouse-build had theirs in 48 hours. Pricing is one flat $250/month with unlimited users, so the math stays simple while you grow.
FAQ
Can I run analytics directly on my production Supabase database? For light, occasional queries, yes. Heavy or recurring analytical queries compete with your app for compute — which is why Supabase recommends a read replica for complex analytical work.
Does a read replica solve Supabase analytics? It solves the contention, not the analytics. You still have a row-oriented engine, RLS and JSONB friction, and a single source — at roughly double your database spend.
What are Supabase Analytics Buckets, and should I use them? Iceberg-backed columnar object storage for analytical datasets — infrastructure, not an analytics product. There's no query UI, and managed replication into them (Supabase ETL) is in private alpha. They matter mostly as confirmation that analytics belongs in a columnar layer outside production Postgres.
Do I need a data warehouse for one app on Supabase? For internal reporting, usually not. You need somewhere your sources come together — that can be an integrated platform instead of a warehouse you assemble. A full warehouse stack earns its keep at scale, with a data team to run it.
What about analytics inside my product, for my customers? Different problem — per-tenant isolation, sub-second latency, production SLAs. Scope it separately: embedded analytics for SaaS. And if you meant product event tracking (PostHog-style), that's its own decision too.
If I adopt a platform like Definite, is my data locked in? Look for open formats. Definite's lakehouse is open Parquet and Iceberg-interoperable, and can live in a bucket you own — the same open-formats logic Supabase's Analytics Buckets are built on.