Combining Stripe, GA, and CRM Data: Five Approaches — and Why Only Two Survive Six Months

Your CEO asks which marketing channel drives the highest-LTV customers. Simple question. To answer it, you need to match Stripe payment history to Google Analytics acquisition data to CRM lead sources. So you open three tabs, export three CSVs, and start VLOOKUPing in a spreadsheet. By the time you have a number, it's Tuesday and the question has moved on.
If you've tried the "easy" fixes — Databox shows metrics from each source side by side but can't actually connect the data, Looker Studio can do the joins but only after you build a mini data warehouse with Fivetran and BigQuery — you already know the problem isn't a lack of dashboard tools. It's that your data can't talk to itself.
This guide walks through five real approaches to unifying Stripe, Google Analytics, and CRM data, with honest tradeoffs for each. No "just use Zapier" hand-waving. No enterprise-grade architectures that assume you have a data team. This is for the person who is the data team.
What you'll learn:
- Why combining data from these three tools is harder than it looks (the identity resolution problem)
- Five approaches compared — from spreadsheet stitching to unified data platforms — with setup time, cost, and maintenance tradeoffs
- The predictable failure pattern that causes most dashboard setups to get rebuilt within 3-6 months
- How your choice today affects whether AI can help you tomorrow
Which approach fits your situation?
What do you mainly need from combining this data?
The Real Problem: Your Data Can't Talk to Itself
The question isn't "which dashboard tool should I use?" It's "how do I get a Stripe customer, a Google Analytics session, and a CRM contact to refer to the same person?"
This is the part everyone glosses over. Stripe identifies customers by customer_id. Google Analytics tracks visitors with a client_id — which Google's own documentation describes as "a randomly generated value for each user" that "pseudonymously identifies a browser instance." Your CRM stores contacts by email address or an internal record ID.
These three systems have no native bridge between them. There is no "Connect Stripe to GA4" button. The reason your data lives in three tabs isn't a tool problem — it's an identity resolution problem.
Here's the join chain you actually need to build:
GA4 session → (matched via UTM parameters or user_id) → CRM contact → (matched via email) → Stripe customer

Every approach in this guide is really solving this join in a different way — some by faking it (showing metrics side by side without actually joining), some by doing it properly (matching records across systems at the identity level).
Note: This guide focuses on the analytics use case — dashboards, LTV analysis, attribution. If your primary need is operational automation (e.g., "update a CRM field when a Stripe payment fails"), Zapier or Make are purpose-built for that. We cover Zapier below, but the bulk of this guide is about getting answers, not triggering actions.
Five Ways to Combine This Data — Only Two Actually Join It
Here's the honest comparison. Each approach has a real use case — the question is which tradeoffs fit your situation.
| Approach | Setup Time | Can Join Records? | Ongoing Maintenance | Monthly Cost | Best For |
|---|---|---|---|---|---|
| Dashboard aggregator | Hours | No — metrics only | Low | $60-400/mo | KPI overview on a TV screen |
| Zapier / automation | Hours | No — event-based | Medium | $20-100/mo | Operational workflows, alerts |
| Spreadsheet stitching | Minutes | Manual only | High | Free-$100/mo | One-off analyses, tight budgets |
| DIY warehouse + BI | 2-3 months | Yes | High | $500-7,000/mo | Full SQL control, custom models |
| Unified data platform | Days | Yes | Low | Free + usage-based | Cross-source analytics without the assembly |
Dashboard Aggregators: Metrics Side by Side, Not Joined
Tools: Databox ($159/mo+), Geckoboard ($60/mo+), Klipfolio ($120/mo+)
Dashboard aggregators pull KPIs from each of your tools and display them on one screen. You get a Stripe MRR widget next to a GA sessions widget next to a CRM pipeline widget. Looks clean. Ships fast.
The problem is they can't answer the question that sent you searching. "Which marketing channel drives the highest LTV?" requires joining a GA acquisition source to a Stripe customer's payment history. Widget tools don't do this.
To be fair, tools like Databox have added "Data Calculations" that let you blend metrics across sources — for example, dividing Stripe revenue by GA sessions to calculate revenue per session. Klipfolio's PowerMetrics goes further, letting you join datasets from different sources without SQL. These are real capabilities, and for metric-level analysis they work.
But there's a distinction that matters: blending metrics is not the same as joining records. Databox can calculate "Stripe revenue / GA sessions = $4.20 per session." It cannot tell you "this specific GA session from a Google Ads click became this specific Stripe customer who has paid $12,000 lifetime." That requires matching records by identity — email, customer ID, or user ID — across systems. No dashboard aggregator does this at the record level.
When this approach works: You need a live KPI overview — MRR, sessions, pipeline value — on one screen for the team or the board. You don't need cross-source analysis.
When it breaks: The first time someone asks a question that requires connecting a specific customer's journey across tools. That question is coming — usually within the first few months.
Pricing note: Databox retired its free plan in July 2025. Its paid plans start at $159/month. Geckoboard starts at $60/month. For a small team watching costs, these add up fast for what's essentially a display layer.
Zapier and Automation Glue: Events, Not Records
Tools: Zapier ($20/mo+), Make (formerly Integromat), n8n
Zapier connects tools by triggering actions when events happen. "When a new Stripe payment is received, create a row in Google Sheets." "When a HubSpot deal closes, send a Slack message."
This is genuinely useful for operational workflows. But it doesn't create a queryable data layer. Zapier has launched Tables — "a data platform for workflow automation" — which stores records that flow through your Zaps. It's a real step forward. But Tables is built for automation state management, not for analytics. You can't write SQL against it. You can't join your Stripe customers table with your GA4 sessions table by email address and calculate LTV by acquisition channel.
Zapier is a pipe. It moves data between tools in response to events. That's valuable, but it's a different problem than "show me my business data in one connected view."
When this approach works: You need real-time alerts and automated workflows across tools. "Notify me in Slack when a Stripe charge fails for a HubSpot deal over $10K."
When it breaks: You try to use it for analytics — aggregating, joining, or querying data across sources. Zapier connects events, not data.
Spreadsheet Stitching: The CSV Export You Already Know
Tools: Google Sheets + Supermetrics ($69/mo+), manual CSV exports
You already know this approach because you're probably doing it. Export Stripe transactions to CSV. Export GA sessions to CSV. Export CRM contacts to CSV. Paste them into Google Sheets. VLOOKUP until your eyes cross.
It works — in the way that duct tape works. You can answer the question. Once. Manually. And then when someone asks again next week with a slightly different time range, you do it all over again.
Supermetrics and similar tools automate the export step — pulling data from Stripe, GA, and your CRM directly into Google Sheets on a schedule. This saves real time on the extraction, but you're still building formulas to join the data, and Sheets has a hard ceiling on volume. Once you're past a few thousand rows, it slows to a crawl. Google Sheets has a 10-million cell limit, and performance degrades well before that.
When this approach works: One-off analyses, extremely tight budgets, or situations where you need an answer once and won't need to repeat it.
When it breaks: The second time someone asks the same question. Or the moment your Stripe customer list exceeds what a spreadsheet can handle gracefully.
The DIY Warehouse: BigQuery + Looker Studio + 2 Months
Tools: BigQuery/Snowflake + Fivetran/Airbyte + Looker Studio/Metabase/dbt
This is the "proper" approach — the one a data engineer would recommend. Set up Fivetran to sync Stripe, GA4, and your CRM into BigQuery. Write SQL models (maybe using dbt) to join the data. Build dashboards in Looker Studio or Metabase.
It actually works. You get real cross-source joins. You can answer "which marketing channel drives the highest LTV" with a SQL query against properly modeled data. You can build dashboards that update automatically.
The problem is you just built a data stack.
The evidence on timelines is clear: a minimum viable data platform takes 8 to 12 weeks for a team of 2 to 3 engineers. If you're a solo operator — which, statistically, you are if you're reading this — budget 2-3 months to get to your first real dashboard. And the setup is just the beginning: 84% of data teams spend most of their time on data quality and reliability rather than actual analysis, and 67% of centralized enterprises allocate over 80% of their engineering resources just to keeping pipelines running.
The costs stack up too. Fivetran's pricing starts low but scales with data volume. BigQuery charges for storage and queries. Looker Studio is free but limited; Metabase Cloud starts around $85/month. A realistic monthly bill for this stack at a small business is $2,000-7,000 in tools alone — before anyone's time.
If you've done this before and you're evaluating whether to do it again, you already know: 29% of data teams regretted a build decision in the past year, versus only 18% who regretted a buy decision.
When this approach works: You have a dedicated data person (or team), budget for multiple tools, and the time to build and maintain infrastructure. You want full SQL control and custom data models.
When it breaks: You're one person. You don't have 2-3 months. You'd rather spend time on analysis than on pipeline maintenance.
For a deeper look at this tradeoff, see Data Stack vs Data Platform: Why AI Forces the Choice.
A Unified Data Platform Skips the Assembly
Tools: Definite, and a few others in this emerging category
A unified data platform replaces the assembly job itself. Instead of stitching ingestion, warehouse, modeling, and BI into a stack, all of those layers live in one system that was never separate to begin with. You connect your Stripe account, your GA4 property, and your CRM. The platform syncs the data, handles the storage, and lets you query across all three sources — including the record-level joins that dashboard aggregators can't do.
Definite is one example. It has native connectors for Stripe, Google Analytics, HubSpot, Salesforce, Pipedrive, and most other CRMs. Once connected, you can write SQL to join a Stripe customer's payment history with their CRM deal stage and their original GA4 acquisition source — or skip the SQL and ask the AI assistant to build the dashboard. Full SQL, dbt-style models, and custom Python all live inside the same governed system, so you don't trade power for simplicity.
That CEO question — "which marketing channel drives the highest-LTV customers?" — is one query: join stripe_customers to crm_contacts on email, to ga_sessions on user_id, group by first-touch source, sum lifetime revenue. In a unified platform you'd write that query (or ask the AI assistant for it). In a widget tool the query doesn't exist.
A key piece is what holds your metric definitions together. When Stripe says your MRR is one number and your CRM-based report says another, a semantic layer — a shared dictionary of what "MRR," "customer," and "session" mean — provides one definition that governs all dashboards, AI queries, and reports. You define "MRR" once. Every output agrees. For a deeper look at calculating MRR from raw Stripe data, see How MRR is Actually Calculated in Stripe. For a walkthrough of building this in practice, see the Stripe MRR and churn dashboard video.
Setup is measured in days, not months. One case study: a company connected Stripe and HubSpot to Definite and had board-ready revenue dashboards in 7 days — with ARR synced back to HubSpot down to the dollar. On the scaling question: this category is built on warehouse infrastructure (Definite uses DuckDB/DuckLake), so the ceiling is warehouse-scale, not Sheets-scale. You won't outgrow it the way you outgrow Supermetrics at a few thousand rows.
When this approach works: You need cross-source analytics (the real joins, not just side-by-side widgets), you don't want to build infrastructure, and you want it running in days. This is for the person who knows what building a stack costs because they've done it before — and doesn't want to do it again at a company that can't support the headcount.
When it breaks: You need fully custom infrastructure with your own warehouse, your own orchestration, and your own deployment pipeline. In that case, the DIY warehouse approach gives you more control — at the cost of everything described above.
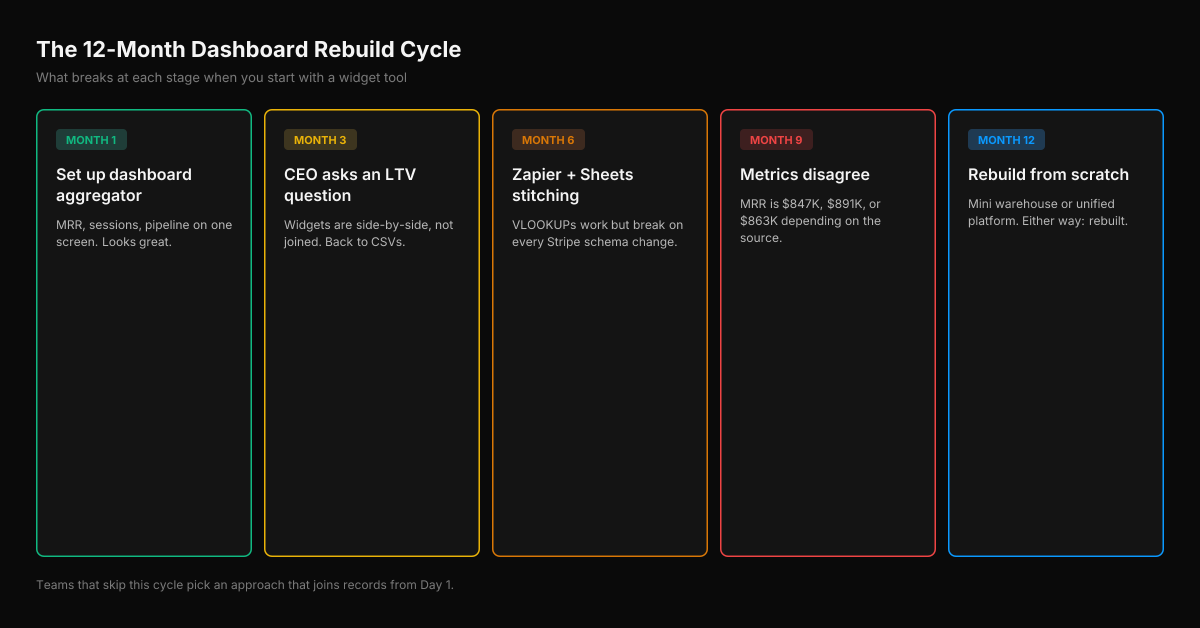
The 3-6 Month Wall: Why Most Dashboard Setups Get Rebuilt
Here's the pattern we see repeatedly — in Reddit threads, in sales conversations, in the tools people abandon:
Month 1: You set up a dashboard aggregator. Stripe MRR, GA sessions, CRM pipeline value — all on one screen. Looks great. CEO is happy. You feel like you solved it.
Month 3: CEO asks, "Which marketing channel drives the highest-LTV customers?" You open the dashboard. The data is right there — Stripe revenue, GA channels, CRM sources — but it's in separate widgets. You can't answer the question without exporting to a spreadsheet and joining manually. You're back to CSVs.
Month 6: You've built a Zapier workflow that sends Stripe data to Google Sheets, where you join it with GA exports using VLOOKUPs. It works, but the Sheets file takes 30 seconds to load and the formulas break whenever Stripe changes an export column. You start researching BigQuery.
Month 9: Your dashboard says MRR is $847K. Your CFO's spreadsheet says $891K. The Stripe report says $863K. Each is "right" under a different definition — different cutoff, different handling of refunds, different treatment of one-time charges. No widget tool ever forced anyone to pick one. Now you have to.
Month 12: You've either built a mini data warehouse (and now spend your time maintaining pipelines instead of doing analysis) or you've found a platform that handles the infrastructure for you. Either way, you've rebuilt from scratch.
The teams that skip this cycle are the ones that choose an approach capable of record-level joins from the start. Not because Month 1 requires it — it doesn't. But because Month 3 always arrives. And the cycle isn't really a tooling problem. It's an architecture problem: you're trying to assemble a stack that never should have been separate pieces to begin with.
Your Dashboard Choice Decides Whether AI Can Help You
This isn't about AI hype. It's a practical decision: the tool you pick today determines whether AI can help you next year.
With a dashboard aggregator, an AI agent can read Stripe metrics and GA metrics separately, but can't reason across them — the data isn't joined. With a DIY warehouse, AI can query the data but only read it. It can answer questions; it can't build the next dashboard or fix a broken pipeline. You're still the bottleneck.
With a unified platform, AI can read the governed metrics and modify the system. An agent can add a new Stripe subscription metric to the semantic layer, update the dashboards that depend on it, and notify you in Slack — without you writing SQL. The AI doesn't just answer questions; it can build and modify the analytics system itself.
Not a reason to pick a platform today — but worth knowing: are you building a foundation AI can work with, or a silo AI can only observe?
FAQ
Can Databox actually join Stripe and CRM data?
Databox can blend metrics across sources — for example, calculating a cross-source ratio like Stripe revenue divided by GA sessions. But it cannot join records — matching a specific Stripe customer to a specific CRM contact by email to trace a full customer journey. For metric-level KPIs, Databox works well. For record-level attribution analysis, you need an approach that can join data at the identity level.
How do I match GA4 sessions to Stripe customers?
There's no native bridge. GA4's client_id is a random browser identifier with no relation to Stripe's customer_id. The standard approach is to set GA4's user_id field (via your site's tracking code) to match the email or ID stored in your CRM when a user logs in. Then the join chain becomes: GA4 session → (user_id) → CRM contact → (email) → Stripe customer. This requires modifying your site's GA4 implementation — a solo operator without engineering access may need help with this step. For a detailed walkthrough of this attribution chain, see HubSpot RevOps Data Automation guide.
What's the cheapest way to get a unified view?
Spreadsheet stitching with manual CSV exports costs nothing but your time. Supermetrics automates the exports for $69/month. Among platforms that can actually join data across sources, Definite offers a free tier with Stripe and GA connectors included. The DIY warehouse route (BigQuery free tier + Airbyte open-source + Looker Studio) has a low entry cost but scales in both money and maintenance time.
Is Stripe Sigma enough for cross-source analytics?
No. Stripe Sigma is excellent for deep analysis of your Stripe data specifically — revenue trends, subscription cohorts, payment failure rates. But it only queries Stripe data. It can't join with GA4 sessions or CRM contacts. Sigma uses subscription-based pricing starting at $15/month for up to 250 monthly charges, scaling to $450/month at higher volumes (we break down every Stripe Sigma pricing tier here). If your questions are Stripe-only, it's worth considering. If you need cross-source views, Sigma is one piece of a larger puzzle. See Stripe Sigma alternatives: when to switch for a detailed breakdown.
How long does it take to set up a unified dashboard?
It depends on the approach. Dashboard aggregators: hours. Spreadsheet stitching: minutes (but maintenance is ongoing). DIY warehouse: 2-3 months for a minimum viable setup. Unified data platform: days — one company went from zero to board-ready dashboards in 7 days. The setup time matters, but maintenance time matters more. A fast setup that requires weekly babysitting is slower in the long run than a slightly longer setup that runs itself.
Your Stripe data, Google Analytics data, and CRM data have the answers your business needs. The obstacle isn't that the data doesn't exist — it's that it lives in three systems that don't talk to each other. Pick the approach that matches your technical capacity, your timeline, and the depth of analysis you actually need. And if you're tired of stitching CSVs and maintaining pipelines, try connecting everything in one afternoon.