HubSpot RevOps Data Automation: The Builder's Guide

You report on pipeline, forecast, and attribution. But 80% of the questions leadership asks require data that doesn't live in HubSpot.
"What's our true CAC payback by channel?" needs GA4 + HubSpot + Stripe.
"Which product features predict deal velocity?" needs your product database + HubSpot.
"Why doesn't our forecast match actual revenue?" needs HubSpot deals + Stripe subscriptions.
You've tried the workarounds:
- Native integrations — too shallow (HubSpot-Stripe sync doesn't calculate MRR)
- Zapier/Make — brittle, breaks constantly, doesn't scale
- Operations Hub — $890-$3,600/mo and you're still stuck in HubSpot's report builder
- "We'll build a data stack" — 6 months later, still on the backlog (and more expensive than you think)
This is integration debt. It's the gap between what leadership asks and what you can actually report on.
This guide shows you how to build a RevOps intelligence layer on top of HubSpot—without rebuilding everything you've already set up, without upgrading to Enterprise, and without hiring data engineers. For the analytical framework first — what to measure, pipeline math, and a metric dictionary you can steal — see our RevOps analytics guide. This guide is the integration layer: getting the data connected so those analytics are possible.
The RevOps Data Architecture
Too many RevOps teams try to force everything into HubSpot. That's why reports break and numbers don't match across systems.
The solution isn't another tool—it's separating execution from intelligence.
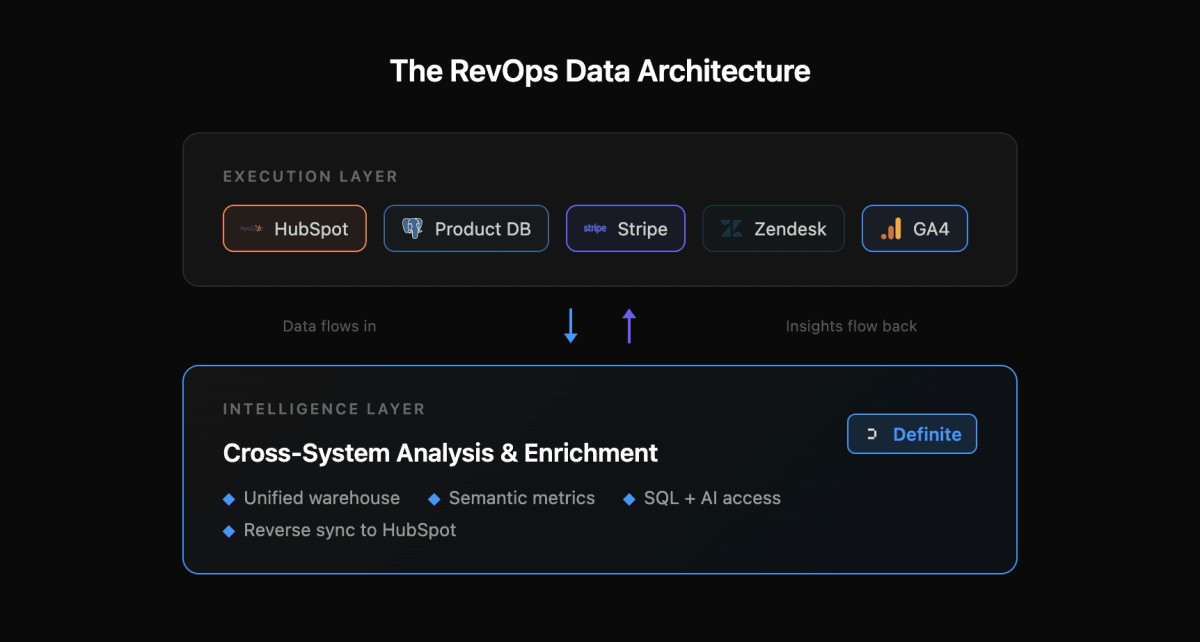
The Execution Layer
This is where daily operations happen—customer engagement, transactions, support interactions. Every action generates data:
- HubSpot: Contact management, deal progression, email sequences
- Product database: User signups, feature usage, activation events (Postgres, MySQL, or your database)
- Stripe: Subscriptions, invoices, actual revenue
- Support tools: Zendesk/Intercom tickets, CSAT scores
- Analytics: GA4 sessions, attribution data
Each system is excellent at its job. But none of them can answer questions that span systems—and that's most of the questions leadership asks.
The Intelligence Layer
This is where cross-system understanding happens:
- All your sources joined in one data warehouse—no more CSV exports or manual matching
- A semantic layer so CAC, LTV, and NRR are calculated the same way everywhere
- SQL and AI access for the questions that come up mid-meeting
- Full history across systems, not just what each tool decides to keep
This is where Definite sits. Not replacing HubSpot—sitting alongside it as your analytical foundation.
The Loop: Execution → Intelligence → Execution
Here's what makes this architecture powerful: data flows both directions.
In: Raw data flows from your execution tools into the intelligence layer. HubSpot deals, Stripe subscriptions, product events—all joined and queryable.
Out: Calculated insights flow back to HubSpot as custom properties:
- Product engagement score
- Churn risk flag
- Expansion opportunity score
- True LTV estimate
Example: A trial user signs up (captured in your product DB), engages with key features (product events), and opens a support ticket (Intercom). In the intelligence layer, these signals combine into an engagement score. That score syncs back to HubSpot—and a workflow automatically notifies the SDR to reach out.
The execution layer gets smarter without anyone manually updating fields.
Where HubSpot Excels—And Where It Hits Hard Limits
Let's be honest about what HubSpot does well.
Where HubSpot Excels
Operational reporting: Pipeline views, deal stage tracking, activity logs, rep dashboards. If your question is "What's in my pipeline right now?" or "Who should I call today?"—HubSpot is excellent.
Historical tracking: Property history shows when fields changed. Deal stage history tracks how long opportunities spent in each stage. This is genuinely useful for velocity analysis.
Workflow automation: Trigger emails based on lifecycle stage, auto-assign leads, create tasks when deals stall. The operational engine is solid.
Where HubSpot Hits Hard Limits
Cross-system joins: HubSpot can't natively join contacts with Stripe customers, correlate GA4 sessions with product signups, or connect support tickets with revenue outcomes. This is exactly what a data warehouse solves—unifying data from multiple systems for cross-system analysis. Operations Hub syncs data into HubSpot, but you're still stuck analyzing within HubSpot's structure.
Complex metric calculations: You can't calculate cohort retention, multi-touch attribution beyond HubSpot sources, or "days between signup and activation" when activation happens in your product. The report builder is powerful but architecturally constrained — the limits come from HubSpot's CRM-first data model, not missing features.
Cost gates: Custom reports require Professional tier ($890/mo). Custom objects require Enterprise ($3,600/mo). Operations Hub adds another $890-$3,600/mo. At that price point, you could build real analytical infrastructure.
The bottom line: HubSpot is an exceptional operational system. It's not an analytical foundation. The gap is cross-system intelligence—and that's exactly what integration patterns solve.
The Three Integration Patterns That Unlock RevOps Analytics
Every revenue leader gets asked these questions. Most can't answer them without a spreadsheet and a prayer.
Pattern 1: Revenue Reconciliation (HubSpot ↔ Stripe)
The Problem
Your CRO asks: "Why doesn't our forecast match actual revenue?"
HubSpot tracks deal amounts—what sales expects to close. Stripe tracks subscriptions—what customers actually pay. These numbers never match, and you're stuck exporting CSVs to reconcile them manually.
The native HubSpot-Stripe integration syncs invoices, but it doesn't calculate MRR, track expansion revenue, or enable cohort analysis. You get data in HubSpot, but not intelligence.

What You Need to Join
| System | Data |
|---|---|
| HubSpot Deals | Amount, close date, company, owner, stage |
| Stripe Subscriptions | MRR, plan, start date, churn events, actual charges |
| Match on | Customer email or company domain |
Metrics This Unlocks
- Forecast accuracy: Predicted revenue vs. actual collected, by rep and segment
- Deal-to-revenue lag: Days from "Closed Won" to first Stripe charge
- True CAC payback: Actual months to recover acquisition cost (not modeled)
- Discount analysis: Which deals closed at list price vs. negotiated down
- Cohort revenue: How much does a Q1 cohort generate over 12 months? (See cohort LTV analysis for the full heatmap methodology)
The Workflow
- Connect HubSpot and Stripe to Definite (5 minutes each)
- Build the join on email/domain
- Create a "Forecast vs. Actual" dashboard
- Share with leadership—finally, one source of truth
See it in practice: Perfect, an AI-powered recruiting platform, connected Stripe and HubSpot to Definite and had board-ready revenue dashboards in 7 days—with ARR synced back to HubSpot down to the dollar. Read the full case study →
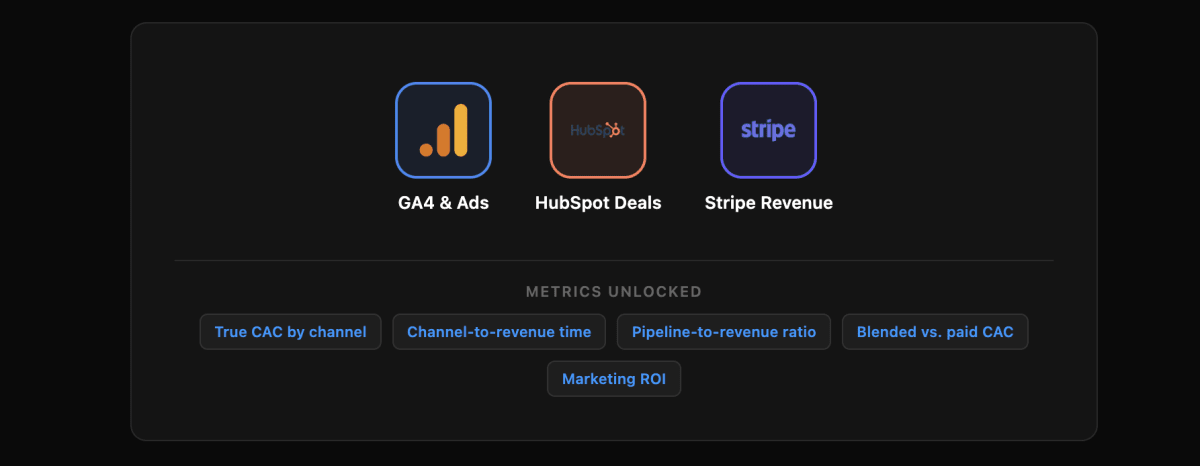
Pattern 2: Full-Funnel Attribution (GA4 + Ads → HubSpot + Stripe)
The Problem
Marketing says the Google Ads campaign drove 200 leads. Sales says those leads were garbage. Finance wants to know why CAC went up 40% last quarter. Everyone's right based on the numbers they're looking at—and that's the problem.
HubSpot tracks lead source, but it stops at first touch. GA4 tracks sessions and conversions, but it doesn't know which sessions became paying customers. Ad platforms report their own conversions, which always add up to more than reality. No single system can connect ad spend to closed revenue.
What You Need to Join
| System | Data |
|---|---|
| GA4 | Sessions, UTM parameters, conversion events |
| Ad Platforms | Spend by campaign, clicks, platform-reported conversions |
| HubSpot Deals | Lead source, deal amount, close date, sales cycle length |
| Stripe | Actual revenue, subscription start, plan type |
| Match on | UTM parameters → HubSpot source fields → Stripe customer |
Metrics This Unlocks
- True CAC by channel: Ad spend divided by actual paying customers, not just leads
- Channel-to-revenue time: Days from first touch to first dollar, by source
- Pipeline-to-revenue ratio: Which channels produce pipeline that actually closes
- Blended vs. paid CAC: Total spend vs. paid-only, tracked monthly
- Marketing ROI: Revenue generated per dollar spent, by campaign
The Workflow
- Connect GA4, your ad platforms, HubSpot, and Stripe to Definite
- Build the attribution chain: session → lead → deal → subscription
- Create a "Channel ROI" dashboard that shows spend, pipeline, and revenue side by side
- Share with marketing, sales, and finance—one set of numbers, no arguments
When the CEO asks "should we double the Google Ads budget?" you have a real answer, not a guess.
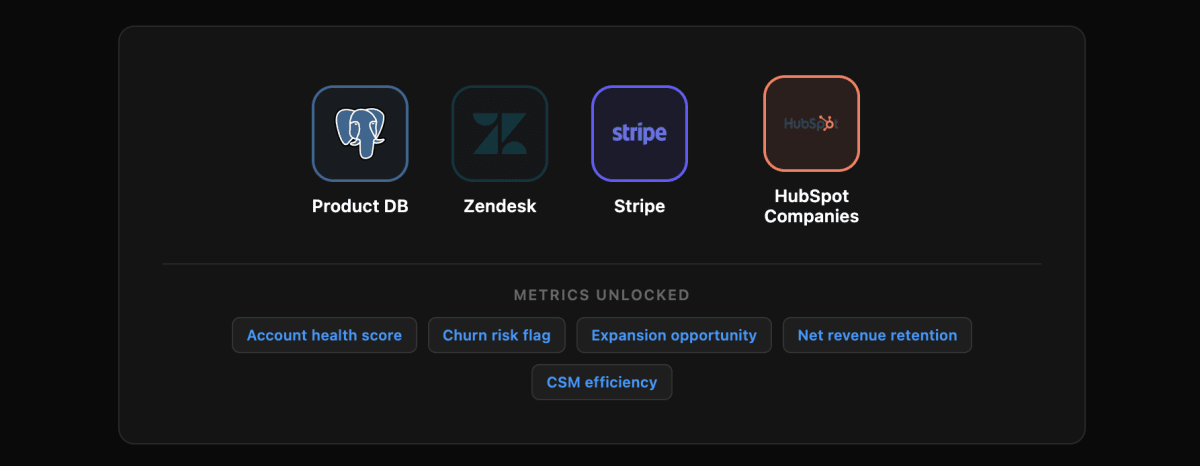
Pattern 3: Account Health & Expansion (Multi-System → HubSpot)
The Problem
Customer Success is reactive. By the time you notice an account is struggling, they're already talking to competitors. And expansion opportunities? You find out about them when the customer asks to upgrade—not when they should upgrade.
Account health requires signals from everywhere: product usage trends, support ticket volume, payment status, contract timing. This data lives in four different systems. Your CSMs are flying blind.
What You Need to Join
| System | Data |
|---|---|
| Product Database | Active users, feature adoption, engagement trends, usage growth |
| Zendesk/Intercom | Ticket volume, CSAT scores, resolution times, sentiment |
| Stripe | Payment failures, plan changes, past-due invoices |
| HubSpot Companies | Renewal date, contract value, CSM owner, lifecycle stage |
| Match on | Company domain or account ID |
Metrics This Unlocks
- Account health score: Weighted composite of engagement + support + payment health
- Churn risk flag: Early warning based on declining usage + support issues
- Expansion opportunity score: Usage growth + approaching limits + renewal timing
- Net revenue retention (NRR): Cohort-based expansion minus churn
- CSM efficiency: Accounts managed per CSM with health-adjusted weighting
The Workflow
- Connect all four systems to Definite
- Calculate health score: engagement (40%) + support health (30%) + payment status (30%)
- Sync health score and churn risk flag to HubSpot company properties
- Create HubSpot workflow: "If churn_risk = TRUE, create urgent task for CSM"
- CSM sees the alert with full context—reaches out before the customer churns
For expansion: "If expansion_score > 80 AND renewal within 90 days, auto-create expansion deal."
Your CS team becomes proactive. Expansion pipeline builds itself.
The Reverse Enrichment Workflow
Every pattern above follows the same loop: pull data into Definite, calculate something HubSpot can't, push it back as a custom property, and trigger a workflow.
That loop is the whole point. HubSpot stays your operational system. Definite calculates the cross-system signals—health scores, engagement scores, churn flags, LTV estimates—and syncs them back on a schedule (daily, hourly, whatever you need). Your workflows get smarter without anyone manually updating fields.
The result: RevOps gets leverage to scale without scaling headcount. Your automation runs on intelligence that spans the full tech stack, not just what lives inside HubSpot.
What RevOps questions go unanswered?
Enter your domain and we'll show you the pipeline, attribution, and forecast questions your revenue team should be able to answer today.
Try it with any company domain — no signup required.
Getting Started
You don't need to rebuild everything. Start with one integration pattern that solves an immediate pain point.
If leadership is asking about forecast accuracy: Start with Revenue Reconciliation (HubSpot + Stripe). You'll have a single source of truth in a week.
If sales is complaining about lead quality: Start with Product-Qualified Leads. Surface product engagement in HubSpot so SDRs prioritize the right accounts.
If CS is reactive and missing expansion: Start with Account Health. Calculate health scores and sync them back to HubSpot for proactive workflows.
Not sure where to start? Our guide to building a data strategy for startups walks through how to pick the right first problem and build from there.
What Definite Gives You
- 500+ pre-built connectors: HubSpot, Stripe, your product database, GA4, support tools—connect in minutes, not months
- Unified data warehouse: All sources joined and governed, no engineering required
- Semantic layer: Define metrics once, use everywhere (no more "which CAC is right?")
- SQL + AI access: Query your data directly or ask questions in plain English
- Reverse sync: Push calculated fields back to HubSpot automatically
- Fast setup: Days, not months. No data engineers required. Teams typically get their first dashboard live within 30 minutes of signing up.
The ROI Math
Building a data stack yourself: (See our complete cost breakdown for detailed analysis)
- Fivetran: ~$1,500/mo
- Snowflake: ~$1,000/mo
- dbt Cloud: ~$100/mo
- Looker: ~$3,000/mo
- Data engineer: $150k+/year
- Timeline: 6+ months
Upgrading HubSpot:
- Enterprise: $3,600/mo
- Operations Hub Pro: $890/mo
- Still can't do cross-system analytics
Definite:
- $250/mo for the Platform tier (platform + connectors)
- Free tier available; Enterprise pricing available for larger teams
- Warehouse, dashboards, AI analyst, and reverse sync included
- Live in days
One Series A B2B company replaced their $5,500/month Fivetran + Snowflake + Looker stack with Definite and had their first cross-system RevOps dashboard live within a week.
Ready to build your RevOps intelligence layer?
Try Definite free and go from raw data to live dashboards in under 30 minutes. Connect HubSpot + Stripe in under 10 minutes and see real cross-system insights the same day.
→ Book a demo — See real RevOps workflows in action → Read the docs — Technical guide to HubSpot integration