How to See Real ROAS Across All Your Facebook Ad Accounts
If you run Facebook Ads for more than one brand or store, you already know the reporting problem. Facebook Ads Manager shows you one account at a time. There is no native cross-account view. And the ROAS it reports uses Facebook's own attribution window — not the revenue that actually hit your Shopify store.
In this video, I connect 10 Facebook Ad accounts and 5 Shopify stores to a single dashboard, then compare Facebook's reported ROAS against actual Shopify revenue. The gap is significant — and for one brand, it is the difference between thinking you are profitable and realizing you are losing money.
Why Facebook's ROAS Is Wrong
Facebook reports ROAS using its attribution window — typically a 7-day click or 1-day view model. If someone clicks your ad on Monday and buys on Thursday, Facebook claims that purchase. Fair enough. But Facebook also claims purchases from people who merely saw your ad in their feed, even if they found your store through Google, email, or a direct visit.
The result: Facebook's reported ROAS is almost always higher than reality. For brands spending heavily on prospecting campaigns — where the gap between ad exposure and purchase is widest — the inflation can be dramatic.
The only way to know your actual return is to compare what you spent in Facebook against what customers actually paid in Shopify. Not what Facebook says they paid. What Shopify recorded.
The Multi-Account Reporting Gap
Most ecommerce operators split their Facebook spend across multiple ad accounts. A common setup is one account for Prospecting and another for Retargeting, per brand. If you run five brands, that is ten ad accounts.
Facebook Ads Manager has no way to view all ten at once. You can see one account at a time. To compare performance across brands, you either:
- Log into each account individually and screenshot the numbers
- Export CSVs from all ten accounts and merge them in a spreadsheet
- Buy a third-party analytics tool and maintain a separate data stack
None of these are fast. None of them connect Facebook spend to Shopify revenue automatically. And none of them update without manual effort. (If you also run Google Ads across multiple MCC accounts, the same unified reporting approach works for Google Ads.)
What the Numbers Actually Showed
In the video, I connected all 10 Facebook Ad accounts and 5 Shopify stores to Definite and asked Fi — Definite's AI agent — to build a cross-account ROAS dashboard. The setup took minutes: connect the accounts, describe the dashboard, and let Fi write the queries and build the visualizations.
Here is what the real numbers looked like across the portfolio:
- Total Facebook spend YTD: ~$121K
- Blended CPC: ~$0.64
- Blended CTR: ~2.7%
Those top-line numbers are useful, but the brand-level breakdown told the real story:
Alpine — $42K in spend, 6.4x actual ROAS. Strong performer. Facebook's reported number was close to reality here because most conversions came from retargeting campaigns with tight attribution windows.
Midnight — $20K in spend, 0.96x actual ROAS. Losing money. Facebook's dashboard probably shows something closer to 2x ROAS for this brand. The gap comes from heavy prospecting spend where Facebook claims view-through conversions that Shopify never recorded as orders.
This is the kind of finding that changes budget allocation immediately. Without matching Facebook spend to Shopify revenue, Midnight looks like a reasonable performer. With the real numbers, it is a brand burning cash.
Prospecting vs. Retargeting: Where the ROAS Gap Lives
The split between Prospecting and Retargeting accounts is not just an organizational convenience — it is where ROAS inflation concentrates.
Retargeting campaigns target people who already visited your site or added items to their cart. When they convert, Facebook's attribution is usually accurate because the path from ad click to purchase is short and direct.
Prospecting campaigns target cold audiences. Conversions happen later, through indirect paths, or not at all. But Facebook's view-through attribution window still claims credit for purchases that happen within a day of seeing the ad — even if the customer found your store through a completely different channel.
This means your Retargeting ROAS is probably close to real. Your Prospecting ROAS is probably inflated. And if you are making budget decisions based on Facebook's blended number, you are overweighting Prospecting performance.
A dashboard that breaks out Prospecting vs. Retargeting spend and matches each against Shopify revenue gives you the clarity to allocate correctly.
From 10 Tabs to One Dashboard
The dashboard Fi built in the video includes KPI cards for total spend, blended CPC, and blended CTR across all accounts. Below that, a brand comparison table breaks down spend, revenue, and actual ROAS per brand — with drill-down rows showing each ad account (Prospecting and Retargeting) individually.
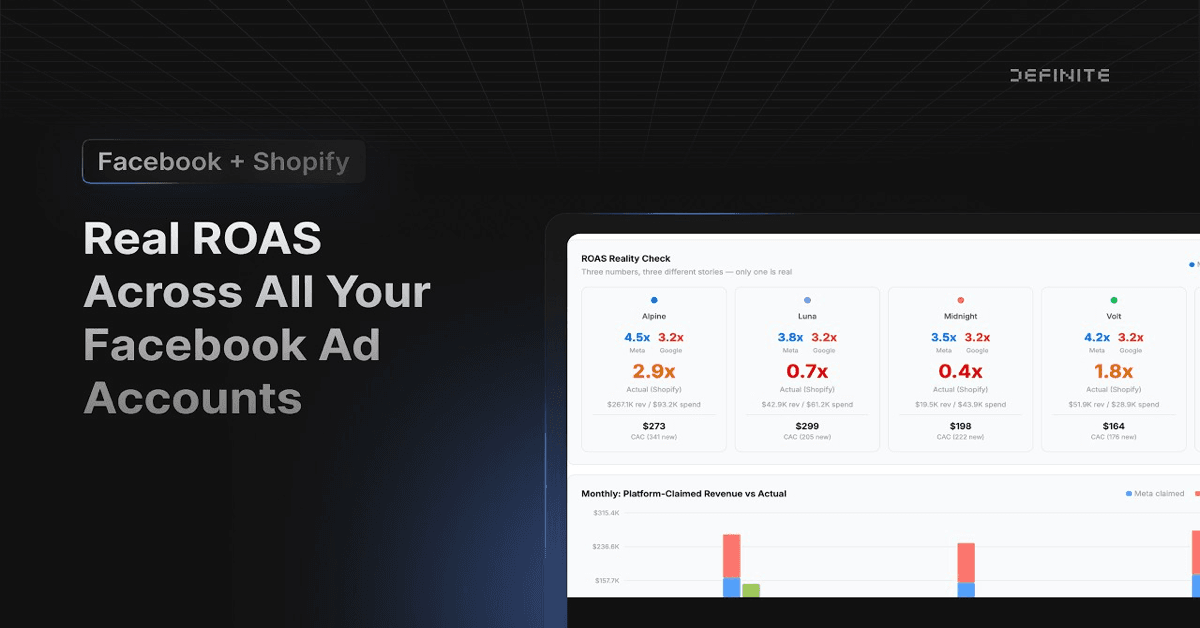
The most useful section is the ROAS Reality Check cards: side-by-side comparisons of Facebook's reported ROAS versus actual ROAS calculated from Shopify data, per brand. You can see exactly where Facebook is inflating and by how much.
I also iterated with Fi to add hover tooltips on each card that show the underlying calculation and data sources — so anyone looking at the dashboard can see exactly how a number was derived. This iterative prompt-to-dashboard workflow is the same pattern described in building data apps with AI.
The manual alternative is logging into Ads Manager, clicking through 10 accounts, exporting spend data, then cross-referencing against Shopify admin for each store. Even for a team comfortable in spreadsheets, that is a half-day project — and the result is already stale by the time you finish.
How to Think About Real ROAS
A few principles for operators running Facebook Ads across multiple stores:
Match spend to revenue at the source. Facebook's reported ROAS is a claim, not a measurement. The measurement comes from comparing dollars spent in Facebook to dollars received in Shopify.
Break out Prospecting and Retargeting. Blended ROAS across both campaign types hides where your money is actually working. Prospecting drives awareness; Retargeting drives conversions. They need different ROAS expectations.
Set a floor, not a target. A 1.0x actual ROAS means you broke even on ad spend (before product costs, shipping, and overhead). Anything below 1.0x is losing money on a gross basis. Your floor should account for contribution margin, not just revenue. Understanding the lifetime value of each customer cohort helps set a more informed floor.
Update weekly, not monthly. Facebook's algorithm shifts performance constantly. A brand that was profitable last month can turn negative in a week if prospecting audiences exhaust or CPMs spike. Automated dashboards that refresh daily catch these shifts before they compound.
Get Started
If you are running Facebook Ads across multiple accounts and stores, the fastest way to see real ROAS is to connect your Facebook Ad accounts and Shopify stores to a single platform and let the data do the math. No spreadsheets, no CSV exports, no switching between ten browser tabs.