Power BI Alternatives: Matched to Why You're Actually Leaving

You're probably using Power BI. Most companies are — it's the most widely deployed BI tool in the world, and for a lot of teams it works fine. Until it doesn't.
The moment the person who configured your dashboards leaves, or Microsoft sends you a licensing email about Fabric that you can't quite decipher, or you realize you need three more tools underneath Power BI before it can show you anything useful — that's when "alternatives" stops being a theoretical search and becomes urgent.
This guide is organized by why you're leaving, not by which logo looks nicest on a feature grid. The right replacement depends on what broke.
Disclosure: Definite is one of the tools in this guide — we wrote it. We've tried to be accurate about the others. Factor that accordingly.
The short version:
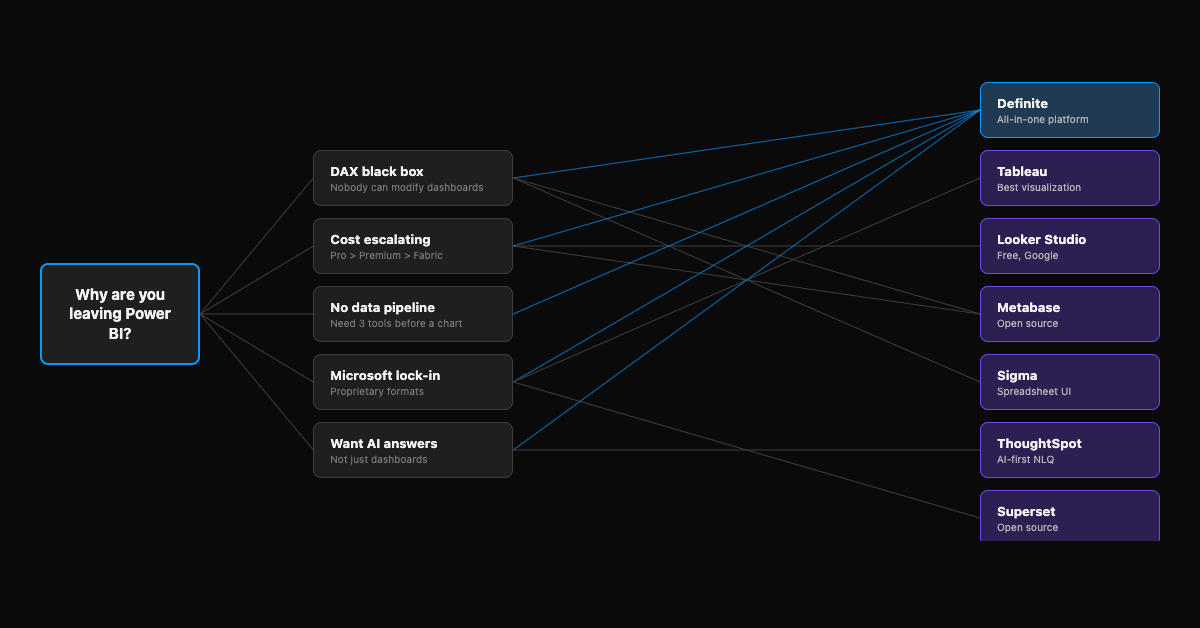
- Skip the data stack entirely: Definite — all-in-one platform with built-in data warehouse, connectors, AI, and dashboards
- Best visualization upgrade: Tableau — if you want chart flexibility and don't mind the specialist dependency
- Zero budget, Google ecosystem: Looker Studio — free, simple, limited
- Open source self-service: Metabase — non-technical users can build dashboards without SQL
- Spreadsheet-familiar UI: Sigma Computing — natural for Excel and Power BI users
- AI-first analytics: Definite or ThoughtSpot — ask questions in plain English, get answers
- Open source, full control: Apache Superset — self-hosted, SQL-native, technical teams
Which Power BI alternative fits your team?
What's the main reason you're looking to leave Power BI?
When to Stay on Power BI
Before we talk alternatives: Power BI is genuinely the right answer for some teams. Switching has real costs, and not every frustration justifies a migration.
- Your team knows DAX and is productive. DAX is Power BI's proprietary formula language. If you have someone who's fluent in it and they're building what the business needs, that expertise has real value. Switching means rebuilding in a different system.
- You're on Microsoft 365 E5 and Pro covers your needs. Power BI Pro is included at no extra cost in E5 subscriptions. If you're already paying for E5 and Pro's dataset limits and sharing features are sufficient, the BI layer is effectively free. If you're hitting Pro's ceiling and looking at Premium or Fabric capacity, that's a different calculation — see licensing that escalates below.
- Fabric is working for you — genuinely working, not just purchased. Microsoft Fabric (GA November 2023) bundles Power BI into a broader data platform — pipelines, a data lake, analytics, AI. If you've committed to Fabric capacity and your team is actually using the pipeline and lakehouse features (not just Power BI with a more expensive license), the ecosystem advantage is real. If Fabric is something you're paying for but haven't fully adopted, that's worth examining more closely.
- Pro licensing fits your scale. At $14/user/month for Pro, Power BI is still one of the cheapest BI tools per seat. If your team is small and your needs are standard dashboards, the cost math may not justify switching.
If none of those apply — or if you're still evaluating Power BI and haven't committed — keep reading.
Why Teams Leave Power BI
The DAX black box
Power BI dashboards are built on DAX — a formula language that's powerful but proprietary and notoriously difficult to learn. For report consumers (people viewing dashboards), this doesn't matter. For report creators (people building and modifying dashboards), DAX is the bottleneck.
When the person who built your dashboards leaves, you inherit a system that works but that nobody can change.
One mid-size services company we talked to had built their entire Power BI reporting on custom code — filtering buttons wired through embedded dashboards. It worked, until someone needed to change a view. Nobody could. The whole system was fragile because it depended on one person's implementation knowledge.
This isn't unique to Power BI — Tableau has the same problem with workbooks, Looker with its proprietary modeling language. But DAX is particularly opaque because it's proprietary. The skills don't transfer to other tools, and modifying someone else's DAX models requires deep familiarity with their specific approach.
Microsoft has started addressing this with Copilot for Power BI, which can generate DAX formulas from natural language. The catch: Copilot requires Fabric F64+ capacity — not included in Pro or Premium Per User. For many teams, the AI that would solve the DAX problem is priced beyond reach.
Licensing that escalates
Power BI Pro is $14/user/month — up 40% from $10 as of April 2025. That's still reasonable for a BI tool. The problem isn't Pro — it's what happens when you outgrow it.
Need larger datasets or paginated reports? Premium Per User is $24/user/month. Need dedicated capacity for your organization? Premium starts at $4,995/month. Want Copilot's AI features? That requires Fabric F64+ capacity on top of everything else.
A 50-person company on F32 capacity pays roughly $4,200/month for compute, plus $700 in Pro licenses, plus storage, plus someone to manage it all. That's $5,000+ before you've built a single dashboard.
The pricing page looks simple. The upgrade path isn't.
No built-in data pipeline
Power BI visualizes data you've already moved somewhere else. It connects to databases, Excel files, and some cloud services — but it doesn't pull data from your SaaS tools, store it in one place, or prepare it for analysis.
For a team pulling from Stripe, HubSpot, and a Postgres database — and wanting to see all three in a single view — Power BI answers the wrong question. You need a data extraction tool to move the data, a warehouse to store it, and then Power BI to visualize it. That's three separate tools before you see a chart.
One 30-person SaaS company we spoke with was running five tools: one for events, one for extraction, one for storage, one for transformation, and Power BI on top. Nobody trusted the numbers because each tool defined metrics differently. The data existed — it just lived in five places that never agreed. The head of customer success was effectively blind to real retention numbers because the tools told different stories.
Microsoft lock-in
DAX formulas, Power Query (Microsoft's data preparation tool), and .pbix dashboard files are all proprietary. Your dashboards don't export to other tools — if you leave, every dashboard rebuilds from scratch. Your DAX skills partially transfer as concepts (measures, calculated columns exist in other semantic layers), but the implementations don't.
Even sharing is constrained: Power BI requires paid seats for anyone who needs access. The free Desktop version is individual-use only — you can't share dashboards outside your organization without Pro licenses.
If you decide to leave in two years, you're doing the same migration you'd do today.
The BI Tool Isn't Your Cost Problem
Here's the part most guides skip: Power BI is the cheapest part of your analytics setup.
Pro at $14/user/month is not breaking your budget. What breaks it is everything else you need to make Power BI useful. For a typical 50-person B2B company with 4 data sources:
| Layer | Tool example | Typical monthly cost |
|---|---|---|
| ETL / ingestion | Fivetran | $20–$500 |
| Warehouse | Azure SQL / Snowflake | $300–$700 |
| Transformation | dbt Cloud | $300–$500 |
| BI / dashboards | Power BI Pro (10 users) | $140–$240 |
| Tech total | $760–$1,940 | |
| Data team (quarter of a full-time hire) | $3,500–$4,000 | |
| Fully loaded total | $4,300–$5,900/mo |
Ranges based on 2025–26 vendor pricing for a 50-person company with 4 data sources.
Power BI is 5–10% of your total spend. Switching from Power BI to Tableau saves you on the BI line — and changes nothing about the other 90%. This is why all-in-one platforms exist as an alternative to assembling a stack. But even if one isn't right for you, understanding the full cost changes how you evaluate alternatives.
Find Your Alternative by Exit Trigger
Start here — then read the full entry below.
| If you're leaving because… | Start with |
|---|---|
| DAX complexity / nobody can modify dashboards | Definite, Metabase, Sigma |
| Cost / licensing escalation | Metabase, Looker Studio, Definite |
| Need AI answers, not just dashboards | Definite, ThoughtSpot |
| No data pipeline underneath Power BI | Definite |
| Microsoft lock-in / platform-agnostic | Definite, Tableau, Looker Studio, Superset |
| Want spreadsheet-familiar UI | Sigma |
| Need open source / self-hosted | Metabase, Superset |
1. Definite — Skip the Stack, Not Just the BI Tool
| Connectors | Starting price | Ops overhead | Eng. required? |
|---|---|---|---|
| 500+ (Stripe, HubSpot, Salesforce, Postgres, and more) | Free / $250/mo | Near-zero | No |
Most alternatives on this list replace your BI tool with a different BI tool. You still need to set up ETL, maintain a warehouse, build a transformation layer, and wire them together. Definite replaces the need to make those decisions at all.
It's a data platform in an app — connectors to your SaaS tools and databases (Postgres, MySQL, Redshift, BigQuery, Salesforce, Stripe, HubSpot, and 500+ more), a built-in warehouse (DuckLake), a semantic layer for governed metrics, dashboards, and Fi — an AI assistant that lets anyone on your team ask questions in plain English. When you need more control, full SQL access is always available.
What you're actually replacing: The full stack — Power BI + extraction tool + warehouse + transformation layer (typically $1,400–$3,800/month in tools alone for a 50-person company) — with a single platform at $250/month.
Migration from Power BI: Hours with onboarding support, not weeks. You reconnect to your source systems directly — you're not moving warehouse data. Your historical data stays where it lives (Stripe, Salesforce, Postgres). Most teams have dashboards running within a week.
Best for: Teams that want answers from their data without assembling a multi-tool stack — whether you're a solo analyst responsible for the entire analytics function, or a team where "data person" is a side responsibility tacked onto someone's actual job title.
Honest caveat: Definite prioritizes speed-to-answer over chart customization. If pixel-perfect, highly customized visualizations for board decks are the primary output, Tableau gives you more control over individual charts. Definite is strongest for teams that haven't invested heavily in a custom stack — or teams where the stack investment isn't paying off.
Price: Free (Starter), $250/month (Standard — one platform that replaces your ETL, warehouse, and BI tool in a single bill). See full pricing →
See also: Power BI vs. Definite →
2. Tableau — The Visualization Upgrade
| Deployment | Starting price | Ops overhead | Eng. required? |
|---|---|---|---|
| Cloud or on-premise | $75/user/mo (Creator) | Medium | Yes (for setup) |
Tableau has the best chart editor in BI. If your exit trigger is wanting more visualization flexibility than Power BI provides — or you want to leave the Microsoft ecosystem for something platform-agnostic — Tableau is the established answer.
Since Salesforce's acquisition in 2019, Tableau has been pushed deeper into the Salesforce ecosystem. Tableau Pulse (launched 2024) adds AI-generated metric summaries for non-technical users — useful, but it's a read-only layer. It doesn't solve the authoring bottleneck.
Best for: Teams with a Tableau-trained analyst who need visualization flexibility and are willing to maintain a separate data pipeline underneath.
Honest caveat: You're trading one specialist dependency for another. The person who configures Tableau becomes the new "person who built it." And Tableau is just the viz layer — you still need ETL, a warehouse, and a transformation tool. At $75/user/month for Creators, the total stack cost often exceeds what you were paying for Power BI.
Price: Creator $75/user/mo, Explorer $42/user/mo, Viewer $15/user/mo (billed annually). See also: Power BI vs. Tableau → | Tableau alternatives →
3. Looker Studio — Free, If You're in Google's Ecosystem
| Deployment | Starting price | Ops overhead | Eng. required? |
|---|---|---|---|
| Cloud (Google) | Free | Low | No |
Looker Studio (formerly Google Data Studio, rebranded October 2022) is Google's free dashboarding tool. It connects natively to Google Sheets, Google Analytics, BigQuery, and hundreds of third-party sources through community connectors.
If your exit trigger is pure cost — Power BI licensing is too much and you just need basic dashboards — Looker Studio eliminates the bill entirely. Unlimited viewers, no credit card.
Best for: Startups with no analytics budget who live in Google Workspace and need simple dashboards.
Honest caveat: No semantic layer, no data governance, limited support. Complex data models break. Community connectors vary in quality and reliability. Looker Studio Pro adds enterprise features at $9/user/project/month — note the "per project" qualifier, which can multiply costs if you work across multiple projects. Not this one if your data isn't primarily in Google's ecosystem.
4. Metabase — Open Source Self-Service
| Deployment | Starting price | Ops overhead | Eng. required? |
|---|---|---|---|
| Self-hosted or Cloud | Free (OSS) / $85+/mo (Cloud) | Medium (self-hosted) / Low (Cloud) | No |
Metabase is open-source BI with a visual query builder that lets non-technical users genuinely build dashboards without writing SQL. According to Metabase, over 50,000 organizations use the product; the GitHub repo has 38,000+ stars.
If your exit trigger is DAX complexity — you want your ops manager to build and modify reports without calling a contractor — Metabase is the most accessible option on this list.
Best for: Budget-conscious teams who want non-technical users building their own dashboards. Works well for internal tools and simple analytics.
Honest caveat: Metabase is a BI tool, not a platform — no ETL, no built-in warehouse. You need both underneath it. The free open-source version and paid Cloud product are meaningfully different: SSO, embedding, row-level permissions, and white-labeling all require paid plans. For a 25-person team, Metabase Pro plus per-user costs can run $755/month for BI alone — before you add the warehouse and ETL tool underneath.
Price: Free (open-source, self-hosted). Starter $100/month (5 users). Pro from $575/month. Enterprise custom. See also: Definite vs. Metabase →
5. Sigma Computing — The Spreadsheet-Style Bridge
| Deployment | Starting price | Ops overhead | Eng. required? |
|---|---|---|---|
| Cloud (requires warehouse) | Contact sales | Low | Yes (warehouse setup) |
Sigma Computing is the natural transition for teams where everyone thinks in spreadsheets. The UI maps familiar grid interactions — filtering, pivoting, formulas — to SQL operations running against your cloud warehouse. If your team is fluent in Excel and finds DAX unnecessarily complex, Sigma closes the gap without forcing them to learn SQL.
Best for: Teams heavy on Excel who want warehouse-powered analytics without leaving the spreadsheet metaphor.
Honest caveat: Sigma requires a cloud data warehouse — Snowflake, BigQuery, Databricks, or Redshift. It doesn't include data storage or ETL. If you don't already have a warehouse, Sigma doesn't help with the pipeline problem — it's a BI layer that assumes the infrastructure exists. See sigmacomputing.com/pricing for current plans.
See also: Sigma vs. Definite →
6. ThoughtSpot — AI-First Analytics
| Deployment | Starting price | Ops overhead | Eng. required? |
|---|---|---|---|
| Cloud (requires warehouse) | Team: $95/mo (5M rows) | Low | Yes (warehouse setup) |
ThoughtSpot has the most complete natural language querying implementation in the BI market. ThoughtSpot Sage lets users type questions — "revenue by region last 90 days" — and get instant, AI-generated answers.
If your exit trigger is that you want AI-powered answers rather than static dashboards, ThoughtSpot is purpose-built for this. Leadership teams that never logged into Power BI may actually use ThoughtSpot because the interaction model is fundamentally different.
Best for: Leadership teams who want to ask data questions in plain English without learning a BI tool.
Honest caveat: ThoughtSpot is an AI/NLQ layer, not a full BI platform — you'll still need to build and maintain traditional dashboards elsewhere. It requires a cloud warehouse. Pricing is consumption-based and enterprise-oriented: the Team edition starts at $95/month for up to 5 million rows, but scales quickly. Pro and Enterprise tiers require a sales conversation.
See also: ThoughtSpot vs. Definite →
7. Apache Superset — Open Source, Full Control
| Deployment | Starting price | Ops overhead | Eng. required? |
|---|---|---|---|
| Self-hosted or Preset (managed) | Free (OSS) | High (self-hosted) | Yes |
Apache Superset is an open-source data exploration and visualization platform originally developed at Airbnb. It's SQL-native, connects to most databases, and has a large open-source community. Preset is the managed cloud version if you don't want to self-host.
If your exit trigger is Microsoft lock-in and you want full control over your analytics stack — open source, self-hosted, no vendor dependency — Superset is the most established option.
Best for: Technical teams with SQL fluency who want open-source analytics without vendor lock-in.
Honest caveat: Superset requires a data engineer to deploy, configure, and maintain. No built-in ETL, no managed warehouse, no AI assistant. The learning curve is real — this is a tool for people comfortable with SQL, Docker, and infrastructure management. If you're leaving Power BI because it was too complicated, Superset may not be the step down in complexity you're looking for.
What could your data tell you?
See the business questions your tools can already answer — you just can't ask them yet.
Try it with any company domain — no signup required.
Side-by-Side: One Column Changes the Decision
| Tool | Type | Built-in pipeline? | AI / NLQ | Starting price | Best for |
|---|---|---|---|---|---|
| Definite | All-in-one platform | Yes | Fi (full AI assistant) | Free / $250/mo | No dedicated data team |
| Tableau | BI tool | No | Pulse (read-only summaries) | $75/user/mo | Visualization depth |
| Looker Studio | BI tool | No | No | Free | Google ecosystem, zero budget |
| Metabase | BI tool | No | No | Free (OSS) / $85+/mo | Non-technical self-service |
| Sigma | BI tool | No | No | Contact sales | Excel-familiar teams |
| ThoughtSpot | AI analytics | No | Sage (NLQ) | $95/mo (Team) | Leadership NLQ |
| Superset | BI tool (OSS) | No | No | Free (OSS) | Technical, open source |
One column changes the economics of the decision: Built-in pipeline. Every tool except Definite assumes you've already solved data ingestion and warehousing. If you haven't, add a separate ETL tool and a cloud warehouse on top of whichever BI tool you pick.
Pricing verified March 2026. SaaS pricing changes frequently — verify current rates at each vendor's website before making a purchase decision.
What Happens When You Leave Power BI
Do my .pbix files transfer?
No. Power BI's .pbix format is proprietary. No other BI tool imports Power BI workbooks natively. Your dashboards need to be rebuilt in the new tool. The underlying data isn't locked — it lives in your source systems (Postgres, Stripe, Salesforce, wherever). What you're replacing is the visualization layer and the DAX models on top.
The practical silver lining: rebuilding forces a cleanup. Most teams discover they had 30 dashboards and 4 that anyone actually used.
What about my DAX models?
The concepts transfer — measures, calculated columns, and data relationships exist in other semantic layers (Cube, LookML, dbt metrics). The implementations don't. You won't export DAX and import it somewhere else. You'll re-express the same business logic in a different system.
For tools with a semantic layer (Definite, Looker, Omni), this is an opportunity to define metrics once in a governed model rather than burying them inside dashboard-specific DAX.
How long does it take?
For most teams (one data person or ops manager doing the rebuild):
- All-in-one platform (Definite): Hours to days. You reconnect to source systems, not migrating warehouse data.
- BI tool swap (Tableau, Metabase, Sigma): 2–6 weeks. Dashboard rebuilds, connector setup, parallel testing.
- Warehouse + BI swap: 3–8 weeks. Everything above plus data migration and query auditing.
Run both systems in parallel for at least a week. Don't shut anything down until the new system shows the same numbers.
What does this look like in two years?
This is the question nobody writes about — and it's the one that actually matters.
Every BI tool creates some form of specialist dependency. The question is how deep it goes. Tableau workbooks need a Tableau developer. Looker dashboards need a LookML engineer. Power BI dashboards need someone who knows DAX.
When you're evaluating replacements, ask: what happens when the person who sets this up leaves?
- Tools with AI assistants (Definite, ThoughtSpot) reduce the dependency because non-technical users can get answers without the builder. The builder's departure is disruptive but not crippling.
- Tools with visual builders (Metabase, Looker Studio) reduce the dependency because others can modify dashboards without specialized skills.
- Tools with proprietary modeling languages (Looker, Sigma) create a new specialist dependency — different from DAX, but structurally similar.
- Open-source tools (Metabase, Superset) give you the code and the data — nothing is locked in a proprietary format. But self-hosted infrastructure needs someone to maintain it.
The most durable systems are ones where the system retains knowledge even when individuals leave — governed metric definitions in a semantic layer, not buried inside one person's DAX formulas or Tableau workbooks.
No tool eliminates the maintenance question entirely. But some tools make it someone else's problem (managed platforms), some tools make it everyone's capability (AI + visual builders), and some tools make it your engineering team's problem (self-hosted). Pick the model that matches the team you actually have — not the team you plan to hire.
FAQ
Is Power BI being discontinued?
No. Microsoft is not discontinuing Power BI — it's absorbing it into Microsoft Fabric. Power BI Desktop still exists, Power BI Pro still exists. What's changing is the context: Power BI is increasingly positioned as one piece of a larger (and more expensive) Microsoft data platform. If you're evaluating Power BI today, you're also implicitly evaluating Fabric — and that's a bigger commitment than just a BI tool.
Should I upgrade to Microsoft Fabric instead of switching?
It depends on what's broken. If your frustration is with Power BI's visualization or DAX complexity, Fabric doesn't fix that — Fabric adds data engineering capabilities (pipelines, a lake, a warehouse) but keeps Power BI as the BI layer. If your frustration is that you need a data pipeline underneath Power BI, Fabric is Microsoft's answer to that — but it comes with significant cost and complexity. See our detailed Fabric analysis →
What's the cheapest Power BI alternative?
Looker Studio and Metabase (self-hosted) are both free — but you'll still need a warehouse and ETL tool underneath them. For a single platform that replaces Power BI, your extraction tool, and your warehouse in one product, Definite starts free and scales to $250/month — often less than teams spend on ETL alone.
Do I need a data engineer to switch?
It depends on where you're going. Migrating to another warehouse-dependent BI tool (Tableau, Sigma, ThoughtSpot) is a data engineering project — pipeline rewiring, query auditing, performance tuning. Migrating to an all-in-one platform (Definite) doesn't require a data engineer because you're reconnecting to source systems, not moving warehouse data. Ops people, RevOps leaders, and executives who inherited a system they didn't build make this decision all the time — you don't need to be a data engineer to choose the right analytics path.
Is Tableau better than Power BI?
Different tools for different exit triggers. Tableau has a better chart editor and is platform-agnostic. Power BI is cheaper per seat and integrates deeply with Microsoft 365. If you're leaving Power BI because of visualization limitations, Tableau is an upgrade. If you're leaving because of cost, Tableau is a step backward ($75/user/mo vs. $14/user/mo). If you're leaving because nobody can modify your dashboards, neither tool solves that — both create specialist dependencies.
The BI tool is 5–10% of the decision. The real question is how much infrastructure you want to build and maintain around it. Two places to start:
Model your current stack costs → — see what teams your size typically pay across ETL, warehouse, BI, and people.
What could your data tell you?
See the business questions your tools can already answer — you just can't ask them yet.
Try it with any company domain — no signup required.
If you want to skip the stack entirely: try Definite free.
Pricing verified March 2026. SaaS pricing changes frequently — especially for Power BI (Fabric licensing restructuring), ThoughtSpot (consumption-based model), and Sigma (contact-sales pricing). Verify current rates at each vendor's website before making a purchase decision.
Not included in this list: Looker (enterprise-tier at $5K+/month — wrong audience for most Power BI replacements), Qlik Sense (enterprise legacy platform, opaque pricing), Sisense (acquired by Perion Network in 2023; product direction uncertain), Domo (enterprise platform, not a first choice for new deployments), Lightdash and Evidence (require dbt — too niche for a general Power BI audience).