Best Tableau Alternatives in 2026: Matched to Why You're Actually Leaving

People will tell you to use Power BI if you use Microsoft products, or Looker Studio if you have no budget. That's a reasonable shortcut, but it routes you by ecosystem and price — not by the actual reason you're leaving Tableau.
If you're looking for Tableau alternatives, you are likely in one of two situations: they're leaving because Tableau costs too much for what they're getting, or because Tableau became a black box the moment the person who configured it left. A few are dealing with both. The right replacement depends on which one you are. If the original goal was "self-service for everyone," read why that rollout usually fails without the data foundation — swapping BI tools rarely fixes it.
This guide is organized by exit trigger. Each tool appears in the context of the problem it actually solves.
Disclosure: Definite is one of the tools in this guide — we wrote it. We've tried to be accurate about the others. Factor that in accordingly.
Quick note on migration: Your historical data isn't going anywhere — it lives in your source systems (Stripe, Postgres, Salesforce, wherever). What you'll need to rebuild are your dashboards. Most teams do this in 2–6 weeks. Full details in the migration section.
Matched by exit trigger:
| If you're leaving because… | Start with |
|---|---|
| Tableau is too expensive (license + admin overhead) | Power BI, Metabase, Looker Studio, Definite |
| Non-technical users can't build or modify dashboards | Metabase, Definite |
| You want AI-powered answers, not just dashboards | ThoughtSpot, Definite, Power BI (with Fabric) |
| You already have a warehouse and want SQL power | Looker, Sigma, Omni, Lightdash |
| You want all-in-one — no ETL, warehouse, or BI to assemble separately | Definite |
| You need to embed dashboards inside your own product | Definite, Omni, Looker |
| You want to pay through AWS | QuickSight |
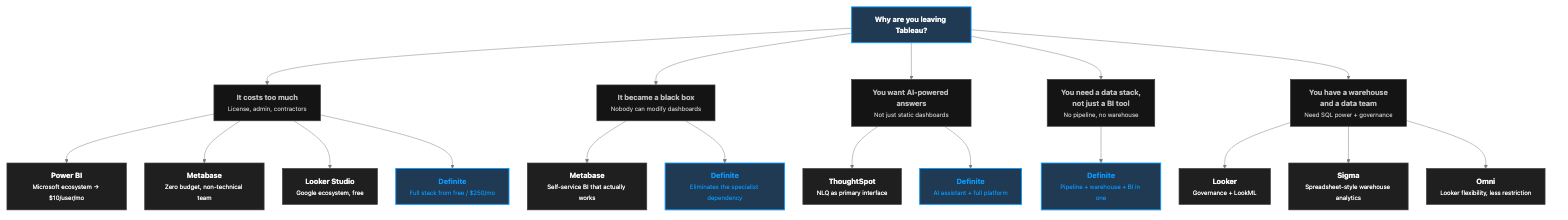
Which Tableau alternative matches your exit trigger?
What's the actual reason you're leaving Tableau?
What You'd Be Trading
Before you pick a replacement, be honest about what you're giving up. Tableau has earned its reputation in a few specific areas — and switching without acknowledging them is how teams end up disappointed three months in.
- Visualization quality. Tableau's chart types, formatting controls, and design flexibility are genuinely best-in-class. If your dashboards live in board decks and need to look polished, most alternatives will feel like a step down — at least at first.
- Connector breadth. Tableau connects to a wide range of databases, SaaS tools, and flat files natively. Most alternatives cover the common cases well (Postgres, Snowflake, Salesforce), but fewer of the long tail.
- Community and training. There's a large library of tutorials, a mature certification program, and a real community of Tableau developers. A Tableau-trained hire is productive on day one.
- Enterprise governance. Tableau Server and Tableau Cloud include row-level security, permissions management, and audit logging. These features exist in many alternatives but are often less mature.
Most alternatives close the gap over time — but "over time" isn't now. Know which of these you'll miss.
What's Driving Startups Away from Tabeau
Cost — and it's not just the license
Tableau is now sold in two tracks, and the difference matters. Tableau Cloud Standard lists Creator at $75/user/month (billed annually). Tableau Enterprise — the Role-Based Edition — lists Creator at $115/user/month, a 53% premium. The Enterprise tier is where the features most teams actually need (advanced data management, ATR analytics, premium support) live, so the "$75/seat" headline understates real-world spend for most companies past 30 employees.
For a team of five Creators on Enterprise, you're looking at $6,900/year in seat cost alone — before Server licensing for on-prem, hosting for Cloud, or the Einstein/Pulse AI add-ons that increasingly gatekeep the parts of Tableau Salesforce is actively investing in.
Since Salesforce's acquisition in August 2019, licensing has restructured from named-user/core to role-based tiers. The Viewer role (lower cost, read-only) creates an asymmetry most teams discover the hard way: your two Creator seats can build, your twenty Viewer seats can only look. Anyone in between who wants to modify a dashboard either gets bumped up to Explorer/Creator pricing or queues up requests for the people who can.
For a full breakdown of what the Tableau stack actually costs — including the tools underneath it — see our BI tools cost guide, or run your own scenario in the cost calculator.
The black box problem — when your data person leaves
Tableau requires technical skill to build and maintain workbooks. The person who configured your dashboards understood the data model, the calculated fields, the filters, the connection logic. When they leave, you inherit a working system with no institutional knowledge of how it works — plus a folder of files named things like Revenue_Dashboard_v3_FINAL_USE_THIS_ONE.twbx.
The result: every change now requires technical intervention. Want to add a calculation to a dashboard? Call a contractor. Want to adjust a filter? Contractor.
Salesforce has responded with Tableau Pulse (launched 2024) — an AI layer that generates metric summaries for non-technical users. Pulse reads data and surfaces narratives. What it doesn't do is let your ops manager create a new view, modify an existing dashboard, or build something new. The authoring bottleneck remains.
No built-in data pipeline
Tableau is a visualization layer. It connects to data sources — it doesn't move, transform, or warehouse data. Before Tableau is useful, you need something else running underneath it: a database, a warehouse, or at minimum a well-structured set of files.
For a startup pulling data from Stripe, HubSpot, and a Postgres database — and wanting to combine them for a single view — Tableau answers the wrong question. It visualizes data you've already assembled elsewhere.
The Salesforce integration pressure
Since the 2019 acquisition, Tableau has been pushed progressively into the Salesforce ecosystem. If you're a Salesforce shop, that has benefits. If you're not, the product roadmap is increasingly optimized for a use case that isn't yours — pricing, support tiers, and AI features (Einstein) oriented accordingly.
Are You Solving the Right Problem?
Before you go through the tool list, it's worth asking a harder question.
The black box problem — dashboards no one on your team can modify, a contractor bill every time something needs to change — is not actually a Tableau problem. It's what happens when analytics depends on a specialist to configure and maintain it. Tableau requires a Tableau developer. Looker requires a LookML engineer. Most BI tools create the same dependency in a different form.
If you switch to a different BI tool, you trade one specialist dependency for another. You'll have the same conversation in two years about whoever configured the new system.
Some teams need a better BI tool. Others need a different approach entirely — one where the system doesn't need a keeper. Those are two different decisions, and the tool list below covers both paths. For teams that want to eliminate the specialist dependency rather than swap it, the Definite section covers that option directly.
The 10 Best Alternatives, Ranked by Exit Reason
Use this matrix to see where each tool lines up with your exit trigger (see the Matched by exit trigger summary table near the top of this guide) before you read the full write-ups. ● = a primary fit for that trigger; ○ = possible with caveats (extra cost, a specialist, a paid tier, or it’s not the product’s main story); — = not where that tool usually wins.
| Tool | Cost / license pressure | Non-technical builders | AI answers (not just dashboards) | All-in-one stack (ingest → BI) | Embedded analytics |
|---|---|---|---|---|---|
| Definite | ● | ● | ● | ● | ● |
| Looker Studio | ● | ● | — | — | — |
| Metabase | ● | ● | — | — | ○ |
| Power BI | ● | ○ | ○¹ | — | — |
| Looker | — | — | ○ | — | ● |
| Sigma | — | ○ | — | — | — |
| ThoughtSpot | — | ○ | ● | — | — |
| Omni | — | — | — | — | ● |
| Lightdash | — | — | — | — | — |
| QuickSight | ○ | ○ | ○ | — | — |
| Domo | — | — | ○ | ○² | ○ |
¹ Power BI: Copilot and Fabric-powered AI typically need Fabric capacity (F64+), not Pro alone — see the Power BI section below.
² Domo: All-in-one at enterprise depth — not a first-choice for new deployments unless you’re already committed; see the Domo section below.
Definite
Best for: Businesses that want to stop managing a data stack and start getting answers
Every other tool in this list solves the visualization layer. Definite solves a different problem: it replaces the need to assemble the infrastructure underneath any BI tool — managed data connectors, a built-in warehouse (DuckLake), a centralized semantic layer, dashboards, AI-powered answers (Fi), and embedded analytics, all in one system.
The practical difference: every other tool connects to data you've already moved somewhere else. Definite moves it, warehouses it, governs it, and analyzes it. For a startup pulling from Stripe, HubSpot, and Postgres — and wanting a single source of truth without hiring a data engineer or stitching together four separate tools — that's where the comparison changes.
When someone leaves your team, nothing breaks. The dashboards don't become a black box. The metrics stay governed. That's what the specialist-dependency problem actually looks like when it's solved.
On cost: the free Growth plan includes the AI assistant, dashboards, and 2 data connectors. The Platform plan is $250/month with unlimited viewers, 500+ connectors, and 100 credits/month. Definite also supports embedded analytics — dashboards inside your own product or internal tools.
What you keep: Non-technical users can see dashboards and get AI answers in plain English. Data is governed and trustworthy. What you trade: Tableau's visualization customization depth. Definite's dashboards are production-quality; they're less flexible than Tableau's chart editor. Price: Free (Growth), $250/month (Platform), Enterprise (contact). See full pricing →
See also: Tableau vs. Definite →
Looker Studio
Best for: Startups with no budget who live in Google Workspace
Previously called "Google Data Studio" — rebranded in October 2022. Free. Connects natively to Google Sheets, Google Analytics, BigQuery, and many others via community connectors.
What you keep: Dashboard creation for non-technical users, shareable reports, unlimited viewers at no cost. What you trade: Visualization sophistication, semantic consistency, any real support. Excellent for simple dashboards; strains on complex data models. Price: Free. Looker Studio Pro (~$9/user/month) adds governance and enterprise features. Not this one if: Your data isn't already in Google's ecosystem, or you need more than basic dashboards.
Metabase
Best for: Startups that want your ops manager to build dashboards without calling IT
Metabase is open-source and free to self-host. The visual query builder lets users explore data and build dashboards without SQL — SQL is available when they need it. 50,000+ organizations use Metabase; 38,000+ GitHub stars means it's not going anywhere.
What you keep: Non-technical team members can genuinely explore and build — it's self-service that actually works. What you trade: Visualization polish, embedded analytics (paid tier only), SSO, advanced permissions. Price: Free (open-source, self-hosted). Cloud/Pro: see metabase.com/pricing. Enterprise: custom. Key caveat: Free OSS and paid Cloud are meaningfully different products. Embedding, SSO, and white-labeling require paid plans.
See also: Metabase pricing — what "free" actually costs →
Power BI
Best for: Teams already on Microsoft 365 or Azure
Power BI has the largest installed base of any BI tool — over 250,000 organizations. If you're paying for Microsoft 365, you may already have it. Power BI is now the BI layer inside Microsoft Fabric (GA November 2023), Microsoft's broader data platform that includes pipelines, data lake storage, and analytics. Fabric is an upgrade path, not a forced migration — Power BI standalone licensing still exists.
Copilot for Power BI is real and useful (AI-powered report creation, DAX query generation). Important caveat: it requires Fabric capacity (F64 or higher), not standard Power BI Pro. If you're evaluating Power BI's AI story, factor in that additional cost. And if Power BI itself turns out to be the wrong escape hatch, we've mapped the Power BI alternatives by the reason teams leave.
What you keep: Familiar dashboard-building paradigm, wide connector library, deep Microsoft integrations. What you trade: Visualization flexibility (more structured than Tableau); the product works best inside the Microsoft ecosystem. Price: Pro: $10/user/month. Premium Per User: $20/user/month. See also: Power BI vs. Definite →
Looker
Best for: Companies with an existing cloud data warehouse and a data engineer on staff
Looker is warehouse-native — it connects to your Snowflake, BigQuery, Redshift, or Databricks warehouse and queries it directly. Dashboards and metrics are defined through LookML, Looker's proprietary modeling language.
⚠️ Pause here if: You're evaluating Looker because your team couldn't maintain Tableau. Looker has the same specialist dependency, just with LookML instead of Tableau workbooks. You'd be trading one keeper for another.
What you keep: Governed semantic layer, enterprise-grade permissions, strong warehouse integration. What you trade: You need a data engineer who knows LookML to set up and maintain models. Not self-service for non-technical teams. Price: Enterprise-tier, typically $5,000+/month. See also: Looker vs. Definite →
Sigma Computing
Best for: Teams who want warehouse analytics with a spreadsheet-style interface
Sigma's primary differentiator is its spreadsheet-metaphor UI — users interact with data through a grid that maps to SQL operations, without requiring SQL. If your team lives in Excel, Sigma's learning curve is shorter than most BI tools.
Sigma requires a cloud data warehouse (Snowflake, BigQuery, Databricks, or Redshift). It doesn't include its own storage.
What you keep: Warehouse power with familiar interface; no-code for most use cases. What you trade: You need a cloud warehouse already in place. If you don't have one, that's a separate purchase and setup. Price: See sigmacomputing.com/pricing. See also: Sigma vs. Definite → Not this one if: You don't already have a cloud data warehouse.
ThoughtSpot
Best for: Leadership teams who want to ask data questions in plain English
ThoughtSpot's primary differentiator is natural language querying via ThoughtSpot Sage. Users type questions — "revenue by region last 90 days" — and get answers directly. This is the most complete implementation of "ask your data a question in English" in enterprise software.
Like Looker and Sigma, ThoughtSpot is warehouse-native.
What you keep: Executive-accessible analytics; ad-hoc questions without SQL. What you trade: Dashboard authoring flexibility; ThoughtSpot is an AI/NLQ tool, not a traditional BI platform. Price: Enterprise pricing; community reports suggest starting around $1,250/month. See also: ThoughtSpot vs. Definite → Not this one if: You also need your team to build and maintain traditional dashboards — ThoughtSpot isn't a full BI replacement on its own.
Omni
Best for: Data teams wanting Looker's governance model without Looker's restrictions
Omni was founded in 2022 by Looker alumni and raised a Series B in 2024. It's warehouse-native and combines a governed semantic modeling layer with unrestricted ad-hoc SQL. The key difference from Looker: in Looker, every query must go through a LookML model. In Omni, you can run free-form SQL that still respects the semantic layer — governed exploration rather than governed-only reporting.
What you keep: Governance, model-driven analytics, SQL flexibility. What you trade: Maturity and community (newer product, smaller ecosystem than Looker). Price: Custom / enterprise. See omni.co for current pricing. Not this one if: You don't have a data engineer — setup requires technical resources.
Lightdash
Best for: Technical teams already using dbt who want BI that builds on their models
Lightdash is open-source and built around dbt — it generates BI metrics directly from your existing dbt models. If you have a dbt project, your metric definitions already exist there; Lightdash surfaces them as dashboards without duplicating the modeling work.
What you keep: Your dbt investment; governed metrics without maintaining a separate semantic layer. What you trade: You must have a dbt project already. This is a genuine prerequisite, not a configuration option. Price: Free (open-source, self-hosted). Cloud: see lightdash.com/pricing. Not this one if: You're not already using dbt. This is a tool for data engineering teams, not a general-purpose Tableau replacement.
AWS QuickSight
Best for: Companies running on AWS who want analytics without leaving their ecosystem
QuickSight connects natively to S3, Redshift, RDS, Athena, and other AWS services. Its pricing model is different from most tools: authors pay a fixed monthly rate; readers pay per session.
What you keep: Tight AWS integration, low per-reader cost at scale. What you trade: Visualization sophistication; QuickSight's charts are functional but less polished. Price: $18/author/month (annual) or $24/month (monthly). Readers: $0.30/session, capped at $5/user/month. [SOURCE: aws.amazon.com/quicksight/pricing — verify at publication] Not this one if: You're not primarily on AWS.
Domo
Best for: Enterprise organizations with existing Domo contracts — not a first-choice for new deployments
Domo is an enterprise all-in-one analytics platform. Pricing is opaque and enterprise-tier (requires a sales conversation). In late 2023, Domo announced a strategic review including potential sale; the company remains independent as of this writing. That history is worth noting before making a multi-year commitment.
Full Comparison Table
| Tool | Time to first dashboard | SQL required? | Built-in pipeline? | AI / NLQ | Starting price |
|---|---|---|---|---|---|
| Definite | Hours | No | ✅ | Fi (full AI assistant) | Free / $250/mo |
| Tableau | Days–weeks | No (drag-and-drop) | ❌ | Pulse (read-only narratives) | ~$75/user/mo |
| Looker Studio | Minutes | No | ❌ | No | Free |
| Metabase | Hours (Cloud) | Optional | ❌ | No | Free (self-hosted) |
| Power BI | Hours | No | ❌ | Copilot (requires Fabric F64+) | $10/user/mo |
| Looker | Days–weeks | Yes (LookML required) | ❌ | Gemini integration | ~$5K+/mo |
| Sigma | Hours (if warehouse exists) | Optional | ❌ | No | [Verify] |
| ThoughtSpot | Days | No (NLQ) | ❌ | Sage AI | ~$1,250/mo |
| Omni | Days | Yes / No (hybrid) | ❌ | No | [Verify] |
| Lightdash | Days (dbt required) | Yes (via dbt) | ❌ | No | Free (OSS) |
| QuickSight | Hours (AWS ecosystem) | Optional | ❌ | QuickSight Q (NLQ) | $18/author/mo |
| Domo | Weeks | No | ❌ | Yes | Enterprise |
One column tells most of the story: Built-in pipeline. Every tool except Definite assumes you've already solved data ingestion and warehousing. If you haven't, add a separate ETL tool (Fivetran, Airbyte) and a cloud warehouse (Snowflake, BigQuery) on top of whichever BI tool you pick. That's the stack you're inheriting.
What it actually costs — Tableau-anchored stack vs. all-in-one
Numbers below come from Definite's data stack cost calculator, modeled on a 40-person B2B SaaS team in the "traction" stage with the core revenue stack (Stripe + Postgres) and a fractional analyst:
| Line item | Tableau-anchored stack | Definite (all-in-one) |
|---|---|---|
| ETL (Fivetran) | $61 | Included |
| Warehouse (BigQuery) | $600 | Included (DuckLake) |
| BI seats (Tableau, mixed roles) | $1,254 | Included (unlimited) |
| Transformations (dbt) | $300 | Included |
| Analytics labor (fractional) | $4,140 | $4,140 |
| Maintenance / data-eng time | $3,825 | Included |
| Monthly total | $10,180 | $4,390 |
That's a 57% reduction — roughly $5,790/month, or $69,500/year that doesn't have to come out of your runway. The savings aren't from cheaper BI seats. They're from collapsing four contracts (ETL + warehouse + BI + dbt) into one and eliminating the maintenance overhead that quietly eats a quarter of a data engineer's time. Re-run with your own inputs →
Pricing verified March 2026. Tool pricing changes frequently — confirm current rates at each vendor's site before purchasing.
What Migration Actually Looks Like
Will I lose my historical data?
No — but it's worth understanding what "your data" means here. Your historical data lives in your source systems: Postgres, Stripe, Salesforce, your data warehouse if you have one. That data doesn't move when you switch BI tools. What you're replacing is the connection layer and the visualizations on top.
If you have data stored only in Tableau extracts (.twbx files) — data that was pulled from a source and saved inside Tableau itself — you'll need to re-establish those source connections. That's a setup task, not data loss.
Do my Tableau workbooks transfer to the new tool?
No. Tableau's .twb and .twbx formats are proprietary. There is no "export to Power BI" or "export to Metabase" button. No other tool imports Tableau workbooks natively. Every dashboard must be rebuilt in the new tool.
The practical silver lining: rebuilding forces a cleanup. Most teams discover they had 40 dashboards, 5 of which anyone actually used.
What about the transition period — old system vs. new?
Running both systems in parallel for a few weeks is normal. Keep Tableau live while you rebuild the dashboards that matter most. Don't shut anything down until the new system is showing the same numbers. If the new dashboards surface different figures than Tableau, that's usually a data connection issue — trace it before assuming Tableau was right.
How long does rebuilding take?
Most small teams (one data person or ops manager doing the rebuild) report 2–6 weeks to rebuild their core dashboards, depending on complexity. Simple dashboards — a handful of charts, one or two data sources — can be rebuilt in a day or two. Multi-source dashboards with custom calculations take longer. Calendar time is usually longer than build time because rebuilding surfaces questions about which dashboards still matter.
Does the math actually work?
For most teams under 100 seats, yes — and quickly. A public 2026 case study of a 500-seat enterprise migrating off Tableau reported roughly $200K/year in license savings alone, before counting the maintenance overhead they removed. Smaller teams won't see absolute numbers that large, but the percentage savings are usually similar — and the calculator above runs your scenario in seconds.
The 2-to-6-week rebuild window is the cost line that surprises people. Plan for it explicitly: what dashboards must run before sunset, what's nice-to-have, and what nobody's actually opened in six months and shouldn't be rebuilt at all.
How long does it take for non-technical users to get up to speed?
- Looker Studio: A few hours if they're already in Google Workspace.
- Metabase: Most users functional within a few days. Visual query builder is intuitive.
- Power BI: Closer to 2–4 weeks for users without prior BI experience.
- Definite: Non-technical users can ask questions via the Fi AI assistant immediately. Dashboard building takes a few days to a week.
FAQ
Is there a genuinely free alternative to Tableau?
Two good ones. Looker Studio (Google) is free with no user limit and no credit card required — connects to Google Sheets, BigQuery, and common SaaS tools via community connectors. Metabase open-source is free if you self-host it on your own server. Both have real limitations vs. paid tools, but for small teams getting started, either is a legitimate option.
Is there a self-hosted Tableau alternative?
For just the BI layer, self-hosted Metabase is the standard answer, and Tableau still sells Tableau Server for on-prem. But a self-hosted dashboard pointed at a SaaS warehouse still ships your data to someone else's cloud. If the real requirement is that data never leaves your environment, you want a self-hosted data stack: connectors, warehouse, BI, and the AI analyst all running inside your own boundary.
Is Power BI better than Tableau for startups?
For most startups, yes — primarily on cost ($10/user/month vs. $75/user/month) and because Power BI integrates tightly with tools many teams already pay for (Microsoft 365, Excel, Azure). The visualization flexibility is more constrained than Tableau's, but for standard business dashboards, the gap is smaller than it appears. The main caveat: Power BI's AI story (Copilot) requires Fabric capacity licensing beyond the standard Pro tier, which adds cost.
What does migrating away from Tableau actually look like?
Your data stays where it is. Your dashboards need to be rebuilt — there's no import tool. See the full migration section above for realistic timelines and what to watch for during the parallel-running period.
Can my ops manager build dashboards without a dedicated data person?
It depends on the tool. Metabase and Looker Studio are designed for this — your ops manager can build and modify dashboards without calling IT. Power BI has a moderate learning curve. Looker, Sigma, and Omni require data team involvement for initial setup. Definite's AI assistant (Fi) lets non-technical users ask questions in plain English; dashboard building is accessible but still has a learning curve.
What am I actually giving up when I leave Tableau?
Primarily: visualization customization depth and the large Tableau community and training ecosystem. Tableau's chart editor is more flexible than most alternatives. If polished, highly customized visuals are core to how your organization presents data externally, factor in time to close that gap. Most teams find the difference matters less than expected once they're three months into a new tool — but the first few weeks of "this doesn't look like our Tableau reports" is real.
Are there Tableau alternatives that support natural-language search instead of dashboards?
Yes — and this is where the category has moved fastest in the last 18 months. ThoughtSpot Sage is the most mature implementation of "type a question, get a chart." Definite's Fi does the same on top of a built-in warehouse, so you don't need to assemble Snowflake/BigQuery + a semantic layer first to make NLQ work. Power BI Copilot is real but practically requires Fabric F64+ capacity, which prices it out for teams under ~100 users. Tableau Pulse generates narrative summaries on existing dashboards but does not let non-technical users author new analyses — that authoring bottleneck is exactly what most teams are leaving Tableau to escape.
Are there alternatives that replace Tableau and Power BI at the same time?
If you're comparing Tableau and Power BI head-to-head, you're usually choosing between two flavors of the same problem: a visualization layer that still requires you to assemble ETL, warehouse, and modeling underneath. Tools in this guide that sidestep both — by bundling the layers underneath the BI seat — are Definite (full all-in-one), Looker Studio (free, Google ecosystem, simpler scope), and Metabase (open-source, no warehouse pipeline but strong self-service). For most growth-stage teams, the more interesting question isn't Tableau or Power BI? — it's do we need either, or do we need a stack that doesn't separate the BI seat from the data underneath it?
Match Your Exit Trigger to the Right Tool
Cost is the main driver: Power BI (Microsoft ecosystem), Metabase (zero budget, non-technical team), or Looker Studio (Google ecosystem, zero budget) are the natural starting points. Definite also does more fore less. These tools solve the license cost problem.
The black box problem is the main driver — non-technical users can't modify anything, every change needs a contractor: Metabase if you want a standalone BI tool with genuine self-service. Definite if you want to eliminate the specialist dependency entirely rather than swap it for a new one.
You want AI-powered answers, not just dashboards: ThoughtSpot (NLQ as the primary interface), or Definite (AI assistant built into the full platform alongside connectors and a warehouse).
You're evaluating because you need a data stack and Tableau came up in the research: Definite. Most startups don't need a better Tableau — they need working analytics without assembling four tools to get there.
If you came here because of cost, you have good options. If you came here because you're tired of being one person's departure away from a broken dashboard, the tool swap won't fix it — the approach has to change.
Pricing verified March 2026. SaaS pricing changes frequently — especially for Power BI (Microsoft Fabric restructuring), QuickSight (AWS quarterly updates), and Power BI Copilot (licensing requirements actively evolving). Verify current rates at each vendor's website before making a purchase decision.
Not included in this list: Sisense (still shipping under Perion ownership and pushing aggressively into GenAI in 2026 with Sisense Intelligence and an MCP server — but enterprise-tier pricing and an embedded-analytics emphasis make it an awkward Tableau-replacement for the audiences this guide serves), MicroStrategy/Strategy (rebranded February 2025; Bitcoin-focused corporate pivot makes it an unusual choice for startup analytics), Chartio (shut down March 2022), Birst (absorbed by Infor; no longer a standalone product), Grafana (infrastructure and ops monitoring — not a business intelligence tool), Hex (data science notebooks for technical teams — not a standalone BI platform).