How to Trace Data Lineage in Definite

Ever wonder where a chart's data actually comes from? With Fi, Definite's AI agent, you can trace any visualization back to its source with a single question.
Table of Contents
How It Works
Tracing data lineage in Definite takes just a few clicks. No need to dig through code or ask your data team.
- Click on a chart or table in your doc
- Click "Add to Fi Context"
- Ask Fi: "Where does this data come from?" or "What's the data lineage?"
Fi launches its data lineage skill and traces the data back from visualization to source. In seconds, you'll see exactly how your data flows through the system.
What Fi Shows You
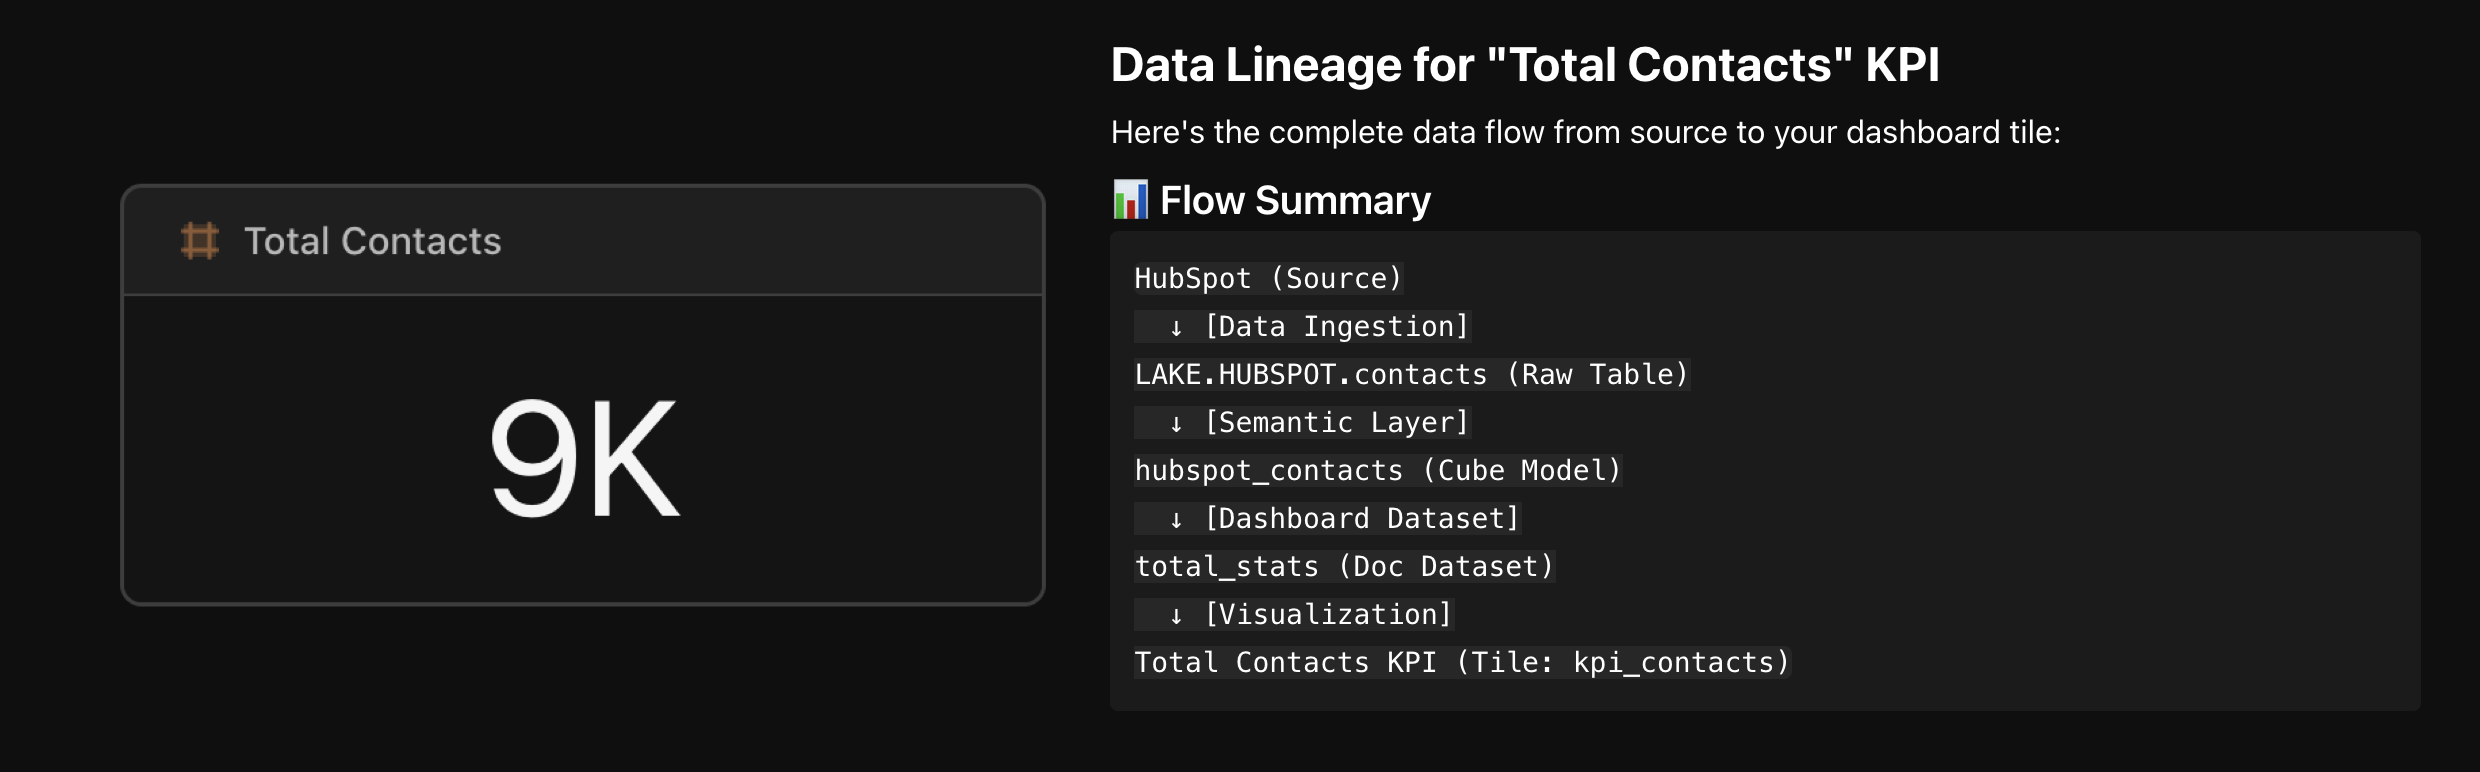
In this example, Fi provides a complete path from source to chart:
| Step | What Happens |
|---|---|
| Source | The raw data source (HubSpot, Stripe, Postgres, etc.) |
| Data Lake | Data is ingested and stored in your managed data lake |
| Semantic Layer | Cube models define metrics and dimensions |
| Visualization | The specific dashboard and chart you selected |
In addition to the flow summary, Fi breaks down:
- Which measures are being used
- Which tables they pull from
- What filters are applied
- How the data refreshes to stay current
This gives you full visibility into your dashboard, so you can trust the numbers you're seeing.
Go As Deep As You Need
Fi can give you a quick overview or a deep dive, depending on what you ask.
Need a simple answer? Ask "Where does this data come from?" and Fi will give you a clear summary of the data flow.
Want more detail? Ask follow-up questions like "What tables does this pull from?" or "Show me the full schema." Fi will dig deeper, showing you the raw table structure, Cube model definitions, and exactly how metrics are calculated.
Whether you need a high-level overview for a stakeholder meeting or a detailed audit trail for debugging, Fi adapts to what you need.
Who Is This For?
- Data teams who need to audit dashboard accuracy
- Analysts troubleshooting unexpected results
- Anyone who inherits dashboards and needs to understand the data flow
- Teams that need to explain their metrics to stakeholders
Get Started
Select any tile in your dashboard and ask Fi about its lineage.
Understanding your data has never been easier. Try it yourself and see exactly where your numbers come from.
- Start free: definite.app/signup
- Read the docs: docs.definite.app