Build & Manage Your Data Stack from Claude Code

Build is the demo. Manage is the job.
Connecting a source, modeling it, shipping a data app — that's a great demo. It's also one Tuesday morning of work. The rest of the week is the schedule that fired at 10am, the run that failed at 2am, the analytics question that came in over Slack on Wednesday, the one more chart the COO wants by Friday. None of that is a "build" moment. All of it is what running a data stack actually looks like.
Two pieces make this work. Definite is the platform — the data lake, the semantic layer, the automations, the data-app runtime. Claude Code is the operator, talking to Definite over MCP — the wire that lets an AI client call platform tools. Neither half does this alone; together they collapse the build and the manage work onto one terminal.
A founder, an analyst, or a single eng lead can run the loop. No data engineer required.
The six-prompt loop
Before the prompts, two prerequisites:
- A Definite account (free tier is fine — sign up here). Once you're in, grab your API key from the user menu in the bottom-left corner of the app.
- Claude Code installed locally.
With those in place, run this once in your terminal (not inside Claude Code) to register the Definite MCP server:
claude mcp add definite \
  --transport http \
  https://api.definite.app/v3/mcp/http \
  --header "Authorization: YOUR_API_KEY"
Then launch Claude Code. It now has 35+ Definite tools available across query (SQL and the semantic layer), integrations, syncs, docs, and Drive. Everything below is what you do with them — and behind every tool call is the Definite platform, hosting the data and running the work.
Prompt 1 — Connect and sync
"Connect to the NBA stats API and sync the data into our data lake."
This is the build prompt: connect a source and land it in the lake. Claude Code calls get_database_schema to see what's already there, create_doc to make the new pipeline, and update_doc_dataset to register the NBA datasets. A "View raw tables" link drops in the terminal.
Click it and the data lake catalog opens. The NBA tables — games, shot_chart_data, play_by_play, box_scores, player_game_logs, line_scores, team_stats, teams — sit alongside 11 other sources already synced into the same governed lake:
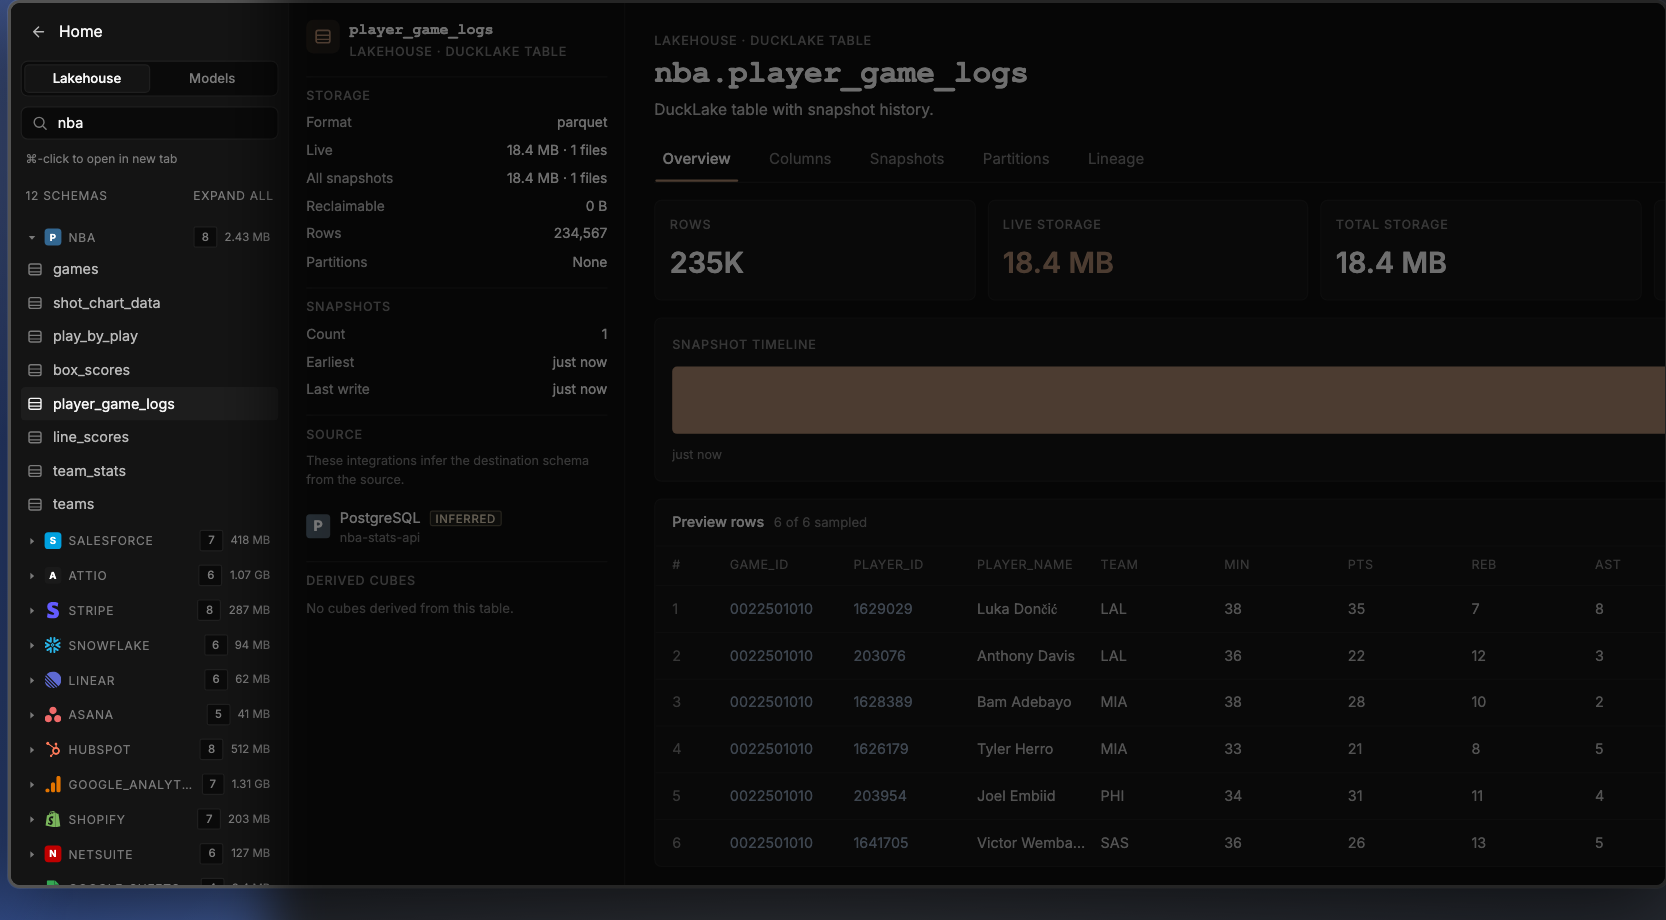
The NBA tables sit alongside 11 other sources already synced into the same governed lake.
Salesforce · Attio · Stripe · Snowflake · HubSpot · Linear · Asana · Google Analytics · Shopify · NetSuite · Google Sheets
That last list is the point. The NBA stats API is just a means to an end — the prompts in this post work the same way against your real business data.
A note on the NBA example specifically: the public NBA stats API is loosely-documented and the schema can shift, so a prompt like "connect to the NBA stats API and sync it" may not return exactly what it returned for me — Claude Code might choose different endpoints, name tables differently, or skip a field. That's fine for a demo. It's also the worst case. Real business sources — Stripe, Salesforce, Attio, HubSpot, and the 500+ pre-built connectors Definite ships — are the opposite: uniform schemas, predictable fields, and a Definite-built connector that lands the same tables every time. The loop gets more deterministic, not less, when you point it at data you actually run on.
Prompt 2 — Schedule the pipeline (no Airflow)
"Run these NBA stats on a schedule every day at 10am."
update_doc fires once with schedule: { cron: "0 10 * * *", tz: "America/Los_Angeles" } and the pipeline is now on a daily 10am PT cron. A "View pipeline →" link drops in the terminal; click it and Definite's Automations page shows the new "NBA Data Pipeline" with run history as a stacked bar chart (success in green, failure in red), a Configure button for cron and destination, and a row-level history table — Run ID, Status, Trigger, Duration, Attempts, Started, Completed.

NBA Data Pipeline run history — stacked bar chart of success/failure, full Run History table below.
What goes away: the separate orchestrator. Definite's Automations handle scheduling and run history natively — Claude Code just sets the cron property on the doc. There's no Airflow or Dagster to stand up, no DAG to author, no run-status dashboard to wire into Slack. The schedule is a property of the pipeline, not a separate system around it.
Prompt 3 — Model the data with the semantic layer
"Now model this data with Cube — semantic models for player-game stats and team-game stats."
This is the modeling prompt: define the metrics once, in one place, so every downstream consumer reads the same definition. Definite uses Cube as the semantic layer underneath. save_cube_model fires three times (nba_player_games, nba_team_games, nba_teams) and the catalog now shows three new models alongside the 20+ already in the project — covering the synced NBA, Salesforce, Stripe, Attio, HubSpot, and the rest.
Drill into nba_player_games and the model shows measures (count, total_pts, avg_pts, fg_pct), dimensions (player_name, team_abbreviation, game_date), and joins to the team and team-game models.
The semantic layer is the reason a question in plain English returns a number worth trusting. Not because Claude Code is smart, but because the platform has one shared definition of every metric. Without it, the analytics question is "write a SQL query against player_game_logs"; with it, the question is just the question.
Prompt 4 — Ask a question (no SQL)
"Who's the most efficient scorer in the regular season this year? Show me the top 5 by true shooting percentage with at least 15 attempts per game."
This is the most underrated prompt in the loop. There's no dashboard yet, no app, no chart — just a question, asked in English. Claude Code calls search_cube_schema to find the right model and measures, then run_cube_query to ask the semantic layer for top 5 players by ts_pct, having fga_per_game >= 15, season = 2025-26. Results stream back in the terminal as a formatted ASCII table:
┌─────┬─────────────────────────┬───────┬─────────┬────────┬─────────┐
│  #  │         Player          │  GP   │  FGA/g  │  PPG   │   TS%   │
├─────┼─────────────────────────┼───────┼─────────┼────────┼─────────┤
│ 1   │ Nikola Jokić            │  65   │  17.4   │  27.7  │  67.0%  │
│ 2   │ Shai Gilgeous-Alexander │  68   │  19.4   │  31.1  │  66.5%  │
│ 3   │ Giannis Antetokounmpo   │  36   │  16.6   │  27.6  │  65.8%  │
│ 4   │ Kevin Durant            │  78   │  17.6   │  26.0  │  64.1%  │
│ 5   │ Stephen Curry           │  43   │  18.6   │  26.6  │  63.7%  │
└─────┴─────────────────────────┴───────┴─────────┴────────┴─────────┘
What goes away: the SQL writing, the warehouse credentials, the "do I trust this number?" check. The platform's semantic layer ran the query against the same model the data app reads — Claude Code just asked. There's no second copy of "what counts as a TS attempt" because there's only one platform definition. The cost of an ad-hoc analytics question drops from "open BI tool, find the right table, write the query, second-guess the join, paste into Slack" to one English sentence in the same terminal you used to build the pipeline.
This is the moment Claude Code becomes a daily interface to the platform — not just a build tool. Most analytics questions don't deserve a dashboard. They deserve a one-shot answer from a governed model.
Prompt 5 — Ship the data app
"Now build me a data app to explore this — games list, game detail with box score, player detail with shot chart."
This is the ship prompt: turn the modeled data into an actual interface someone can use. (A "data app" in Definite is a deployed, hosted internal app — like a Retool or Hex page, but reading directly through the semantic layer.) Claude Code writes app.json and App.tsx via write_drive_file, then runs the build step that packages and deploys the app. An "Open it →" link drops in the terminal. Click it and the NBA Explorer is live: games list filtered by date, drill into LAL @ MIA → full box score, click Stats → team comparison, click Luka Dončić → player detail with a static shot chart.
Prompt 6 — Refine in place (no ticket)
"Add a 3D shot chart with playback animation."
This is the refine prompt — the manage moment most data apps never get because the change-request workflow is too expensive. Claude Code patches App.tsx with a Court3D component (another write_drive_file call), then rebuilds and redeploys. Same URL, same drill state, but click ▶ Replay and Luka's 30 shots arc onto a 3D Lakers court in chronological order. The Jira ticket → frontend engineer → code review → deploy chain collapses to one prompt.
▶ Replay — Luka's 30 shots arcing onto the 3D court in chronological order.
What "manage" actually means
Four of the six prompts (1, 3, 5, 6) get the stack to live. The other two (2 and 4) are what most data teams do every other day. Looked at against a conventional modern data stack:
| Daily / weekly task | Conventional stack | Definite (operated via Claude Code) |
|---|---|---|
| Schedule a pipeline | Open Airflow, write a DAG, commit, deploy | One prompt — no Airflow, no DAG, no engineer |
| Check run history | Open Airflow UI, find the DAG, scroll to last run | Click the link in the terminal — run history is a tab on the same pipeline |
| Ad-hoc analytics question | Open BI tool / SQL editor, write query, paste result | One prompt against the semantic layer — table renders in the terminal |
| Add a chart to a data app | Frontend engineer, ticket, deploy | One prompt — Claude Code patches the file, the build step redeploys in seconds |
| Change a metric definition | Update dbt model, regenerate, propagate to BI | One prompt — one model, one definition, every consumer reads the same number |
Every row is operational friction that goes away: no Airflow DAG to write, no ticket to file, no context-switch between tools. Build is the demo. Manage is the job.
Where this approach is honest about its limits
A few caveats worth stating directly — the kind that show up specifically when you live with the stack day-to-day, not on the demo:
- The terminal is the audit trail. Every tool call is visible in the Claude Code session — but if no one keeps the session, no one sees what happened. For shared teams, the same operations through Fi (Definite's in-product AI assistant) leave a persistent thread anyone can scroll back through.
- Schedules drift. Claude Code will set the cron, but it won't notice next Wednesday that the source API rate-limited and three runs failed. The Automations page does — but you have to look at it. The platform doesn't replace the operations habit; it just makes the habit cost less.
- Ad-hoc queries are not "the dashboard." Prompt 4 is purpose-built for a one-shot question, not for one the team asks twice a week. The recurring question deserves a measure on the semantic layer or a tile on the data app — both still one prompt away.
Try it yourself
The same loop runs against any source you sync — Stripe, Salesforce, HubSpot, your production Postgres, whatever your team actually uses. The NBA was the demo because the data is real and easy to sanity-check; the value is in running it on data you care about.
- Sign up for Definite (free tier) and grab an API key from the user menu
- Run the
claude mcp add definite ...command from the top of this post in your terminal, then launch Claude Code - Run the six prompts against a source you already use. Sync it. Schedule it. Ask it a question. Ship the app. Refine.
One platform. One operator. The whole stack — built and managed — without the multi-vendor coordination tax.