The Founder's Guide to CRM Analytics in Attio

Most founders treat their CRM like a scoreboard—a place to track who’s in the pipeline, what deals are open, and what’s closing soon. That’s fine for visibility, but visibility alone doesn’t drive growth.
The problem is that CRMs like Attio are built to manage relationships, not explain them. Each person, company, and deal is a snapshot of how your business interacts with the market—useful operationally, but incomplete analytically. Hidden in that data are the patterns that reveal why you’re winning or losing—and how to do more of what works.
The difference between managing your pipeline and engineering your growth comes down to one thing: turning CRM data into analytical leverage. Attio captures the what. To grow, you need to uncover the why, connecting your GTM model, metrics, and data management practices into a system of continuous improvement.
This guide walks through how to go from 0 → 1 with Attio analytics:
- Defining meaningful CRM metrics based on your GTM model
- Understanding how Attio’s data model supports (and sometimes limits) what you can measure
- Building a feedback system that turns insights into continuous improvement
Attio analytics isn’t about adding dashboards, it’s about transforming your CRM data from random records into a repeatable growth system.
From Managing Relationships to Engineering Growth
At its core, every CRM exists to support two kinds of growth:
- Acquisition—finding and qualifying new customers
- Expansion—retaining, deepening, and growing existing ones
Analytics is the fuel for both. It helps you find leverage—the specific points where small improvements in how you acquire or grow customers compound into meaningful results.
Acquisition analytics starts with questions like:
- Which channels are driving the highest-quality leads?
- Where are deals stalling in our pipeline?
- How many leads do we need to hit our goals?
Expansion analytics continues with:
- Which customers are primed to expand?
- What early signals predict churn or upsell opportunities?
Understanding these two purposes—and how they show up in your CRM data—is the foundation for everything that follows.
Models to Metrics: Translating Strategy into Measurable Systems
Your go-to-market (GTM) model defines your acquisition and expansion strategies, and therefore, what to measure. Attio is exceptionally flexible. It can be shaped to support various GTM models, but each has unique implications for what data you collect and how you analyze it. Your model determines which signals matter, which relationships drive outcomes, and how your CRM should be structured to reflect that reality.
A sales-led company lives in its pipeline.
A product-led company lives in its usage data.
A hybrid team lives in the space between, where product signals meet human judgment.
Each model emphasizes a different definition of progress, and those differences shape both your metrics and your data model.
Attio has a simple data model. In the end, it’s as powerful as you make it.
What is Your GTM Model?
Before you can measure progress, you need to define the model that drives it. It's time to choose your own adventure:
- Are you running a sales-led motion with clear handoffs and deal stages?
- Driving product-led growth, where engagement tells you more than emails ever could?
- Or operating in a hybrid world, where product usage guides human outreach?
Recognizing your model is the first step toward making your metrics meaningful. Once you see how your growth motion shows up in your CRM, you can start to shape the data around it, and that's where analytics begins to create leverage.
Sales-Led Growth (SLG)
If your growth relies on human conversations—outbound, inbound, demos, deals—you're sales-led. Here, Attio acts as your sales command center for qualification and progression.
Definition: Growth driven by outbound or inbound sales motions, human-led qualification and deal progression.
Key Activities: Prospecting, demos, proposals, negotiation, closing.
Data Model Implications in Attio
| CRM Object | Role in Sales-Led Growth (SLG) | Data Model Implications in Attio |
|---|---|---|
| Company | Represents the account you’re selling into—the unit of qualification, segmentation, and deal ownership. | Ensure each company has clear firmographic attributes (industry, size, region). Link every deal to a single company to enable account-level reporting (e.g., win rate by segment). |
| People | Represent individual prospects and stakeholders within the buying committee. | Use roles (e.g., Champion, Decision Maker, Economic Buyer) to track influence and coverage. Capture communication activity to measure engagement by role. |
| Deals | Represent opportunities progressing through your pipeline. | Standardize stage names and definitions. Use consistent close dates, amounts, and stage-change tracking to enable accurate funnel and velocity analysis. |
| Activities (Custom) | Capture the touchpoints driving progression (calls, emails, meetings, notes). | Log all meaningful activity types with timestamps and outcomes. Tie activities to both People and Deals to measure engagement frequency and recency. |
Sales Led Metrics That Drive Revenue
| Metric | Definition & Contribution to Revenue |
|---|---|
| Qualified Leads | The number of prospects (People or Companies) that meet your target criteria (ICP). More qualified leads → more opportunities (Deals) entering the pipeline. |
| Lead-to-Opportunity Conversion Rate | The percentage of qualified People or Companies that convert into Deals. Higher conversion means better messaging and fit, turning attention into pipeline. |
| Win Rate | The percentage of Deals that close as “Won.” Improving win rate increases total revenue without needing more leads or opportunities. |
| Average Deal Size (ACV) | The average revenue per closed Deal, often tied to Company segment or plan type. Increasing deal size multiplies total revenue for the same number of wins. |
| Sales Cycle Length | The average number of days a Deal takes to move from creation to “Closed Won.” Shorter cycles accelerate revenue realization and improve cash flow. |
| Expansion Revenue | Additional revenue from existing Companies through renewals, upgrades, or add-ons. Expansion compounds growth without increasing acquisition costs. |
In a sales-led motion, your CRM isn’t just a record of deals, it’s a reflection of how you sell. Keep the structure tight, the data clean, and every stage aligned to reality. The clearer the system, the more predictable your revenue becomes.
While SLG relies on human qualification, PLG shifts the leverage to product usage—where the signals come from behavior, not conversation.
Product-Led Growth (PLG)
If your product is doing the selling through free trials, activation, and usage, you’re product-led. Here, Attio supports the motion by connecting product behavior to customer context, helping you identify which users are ready to buy or expand.
Definition: Growth driven by the product experience—users self-serve, activate, and convert.
(Attio supports PLG workflows, but core usage data often lives in your app or payments platform, such as Stripe.)
Key Activities: Free trials, onboarding, activation milestones, in-app conversion, usage-based expansion.
Data Model Implications in Attio
| CRM Object | Role in Product-Led Growth (PLG) | Data Model Implications in Attio |
|---|---|---|
| People | Represent contacts (anyone in your ecosystem, such as leads from marketing, inbound requests, or individuals evaluating the product.) | Use People to capture identity and context before or outside of in-app behavior. Store firmographic data (company, title, email source) and link them to Users once they sign up. People form the bridge between marketing engagement and product usage. |
| Users | Represent active product accounts (individuals who have signed up, logged in, or used the product.) | Create or sync a Users object from your product database. Enrich it with telemetry (sign-ups, sessions, features used). These connect to Companies and Workspaces to measure activation, retention, and monetization. Users drive PQL scoring and product-led metrics. |
| Companies / Workspaces | Represent customer accounts or teams using the product. | Link all related users and usage events to a single company record. Store plan type, subscription tier, and lifecycle stage to enable segmentation (e.g., free, trial, paid). |
| Deals (Optional) | Represent revenue events like upgrades, expansions, or renewals. | Use deals to track monetization moments when a workspace upgrades, expands seats, or renews. Include usage-based triggers for opportunity creation. |
Product-Led Metrics That Drive Revenue
| Metric | Definition & Contribution to Revenue |
|---|---|
| Contacts | The number of new People captured through marketing, inbound requests, or manual outreach. They represent interest before product engagement. More contacts expand your potential top of funnel and feed future signups. |
| Signups | The number of new Users created from product or marketing channels. Signups convert interest (People) into product engagement, expanding the top of your self-serve funnel. |
| Signup Rate | The percentage of People who become Users (sign up for the product). A higher signup rate means better onboarding, clearer value communication, and smoother conversion from curiosity to engagement. |
| Activation Rate | The percentage of new Users who complete a key onboarding milestone (e.g., project created, workspace invited). Higher activation means more users experience product value—the first step toward conversion. |
| Product-Qualified Lead (PQL) Rate | The percentage of active Users or Companies that meet behavioral or usage thresholds indicating purchase intent. More PQLs → more high-quality opportunities for sales or upgrades. |
| Activation-to-Paid Conversion Rate | The percentage of activated users or workspaces that convert to paid Deals. Higher conversion directly increases revenue without expanding acquisition volume. |
| Expansion Revenue | Additional revenue from existing Companies via usage-based upgrades, add-ons, or renewals. Expansion compounds revenue growth from your current user base. |
In PLG, growth isn’t driven by conversations but by behavior. Connecting product data to Attio turns every user action into a data point—and every data point into leverage. But Attio alone isn’t built to be your source of truth. For true behavioral analytics and historical tracking, a data platform like Definite should sit at the center, integrating Attio’s structure with your product and billing data to give you the full growth picture.
Hybrid (e.g. Product-Led Sales)
For many teams, the answer isn’t purely product-led or sales-led—it’s both.
If you blend human selling with product usage data, using insights from the product to guide outreach, you’re operating a hybrid motion. This is where the data model becomes the real differentiator: success depends on how well you combine product signals with pipeline structure.
Definition: Growth driven by product usage data that informs and amplifies human-led sales motions.
Key Activities: Identifying usage signals, prioritizing outreach, converting high-intent accounts, expanding existing customers.
Data Model Implications in Attio
| CRM Object | Role in Hybrid Growth (Product-Led Sales) | Data Model Implications in Attio |
|---|---|---|
| People | Represent individual users or contacts tied to product activity or engagement. | Track both behavioral signals (logins, sessions, features used) and relational context (role, title, buying authority). People connect the dots between product usage and sales opportunity. |
| Users | Represent active product accounts whose engagement informs sales prioritization. | Enrich Users with telemetry (frequency, depth of usage). Use this data to trigger outreach sequences or create Product-Qualified Leads (PQLs) when usage spikes. |
| Companies / Workspaces | Represent accounts composed of multiple users, where usage patterns aggregate to account-level intent. | Aggregate user activity at the workspace or company level to identify high-usage accounts. Combine with deal and lifecycle data for expansion targeting. |
| Deals | Represent opportunities sourced or influenced by product behavior. | Create or update Deals when product signals indicate readiness (e.g., increased usage, hitting plan limits). Track stage progression to measure PQL-to-SQL conversion. |
| Activities (Custom) | Represent cross-channel touchpoints driven by product insight. | Log outreach triggered by product signals (emails, calls, demos). These create the feedback loop between data-driven intent and human follow-up. |
Key Metrics That Drive Revenue
Hybrid metrics may lean more toward sales led or product led metrics depending on your specific GTM so they may borrow more heavily from the metrics listed above. These metrics are some that bridge the gap between both previous models.
| Metric | Definition & Contribution to Revenue |
|---|---|
| PQL-to-SQL Conversion Rate | The percentage of Product-Qualified Leads (Users or Companies) that progress to Sales-Qualified Leads (Deals). A higher rate means better alignment between product signals and sales timing. |
| Usage-Triggered Opportunities | The number of new Deals created as a direct result of product activity (e.g., hitting usage thresholds, upgrading limits). This measures how effectively product data drives pipeline creation. |
| Expansion Revenue | Additional revenue from existing Companies triggered by product growth (new seats, feature adoption, plan upgrades). Expansion is the most efficient revenue source in hybrid motions. |
| Revenue per Activated Account | The average revenue generated per Company or Workspace that has reached activation. It reflects both product adoption and sales effectiveness. |
| Sales Efficiency (Revenue ÷ Touchpoints) | The total revenue generated per sales interaction (Activities). It measures how effectively sales resources convert product-qualified intent into closed revenue. |
In a hybrid motion, your product data tells you who’s ready, and your sales process decides what to do next. When synced correctly, Attio becomes your radar, surfacing which customers need a human touch. But hybrid success depends on unifying systems. Similar to PLG, a data platform like Definite should sit at the center, merging product, CRM, and billing data so every outreach is driven by evidence, not guesswork.
From Metrics to Levers: Turning Insight into Action
Metrics are outcomes. Levers are the causes behind them. Analytics connects the two, turning operational data into systems of improvement.
Growth Equations and the Levers Behind Them
Most growth metrics can be expressed as equations. Each variable represents a lever you can pull—a driver that determines performance.
New Revenue Equation:

To increase new revenue, you can:
- Increase pipeline volume - generate more qualified opportunities
- Improve win rate - close a higher percentage of deals
- Grow deal size - expand the average contract value per deal
Each path implies different strategies and data needs inside Attio:
- Volume depends on how well you track and qualify People and Companies
- Win rate depends on consistent Deal stages and disciplined updates
- Deal size depends on segmentation—knowing which customer Company types buy what, and for how much
Equations like this make growth concrete. Instead of saying "we need more sales," you can pinpoint exactly which variable needs to move—and whether Attio is capturing the right data to measure it.
Funnels as the Core Equation of CRM Analytics
Funnels are how growth becomes measurable. They show how inputs progress through sequential stages, with each conversion multiplying—or constraining—the next.
In Attio, funnels turn operational data into analytical structure. They connect People, Companies, and Deals into a system that explains how revenue is created, and where it slows down. Every motion, from outbound sales to product-led expansion, can be expressed as a funnel.
Example 1: Sales-Led Funnel (SLG)
A classic sales-led funnel tracks how leads progress from interest to closed revenue:
Qualified Leads (People or Companies) → Opportunities (Deals) → Closed Won (Deals)
Each transition reveals a different type of leverage:
- Lead → Opportunity: How well you qualify interest into intent.
- Opportunity → Closed Won: How effectively you convert pipeline into revenue.
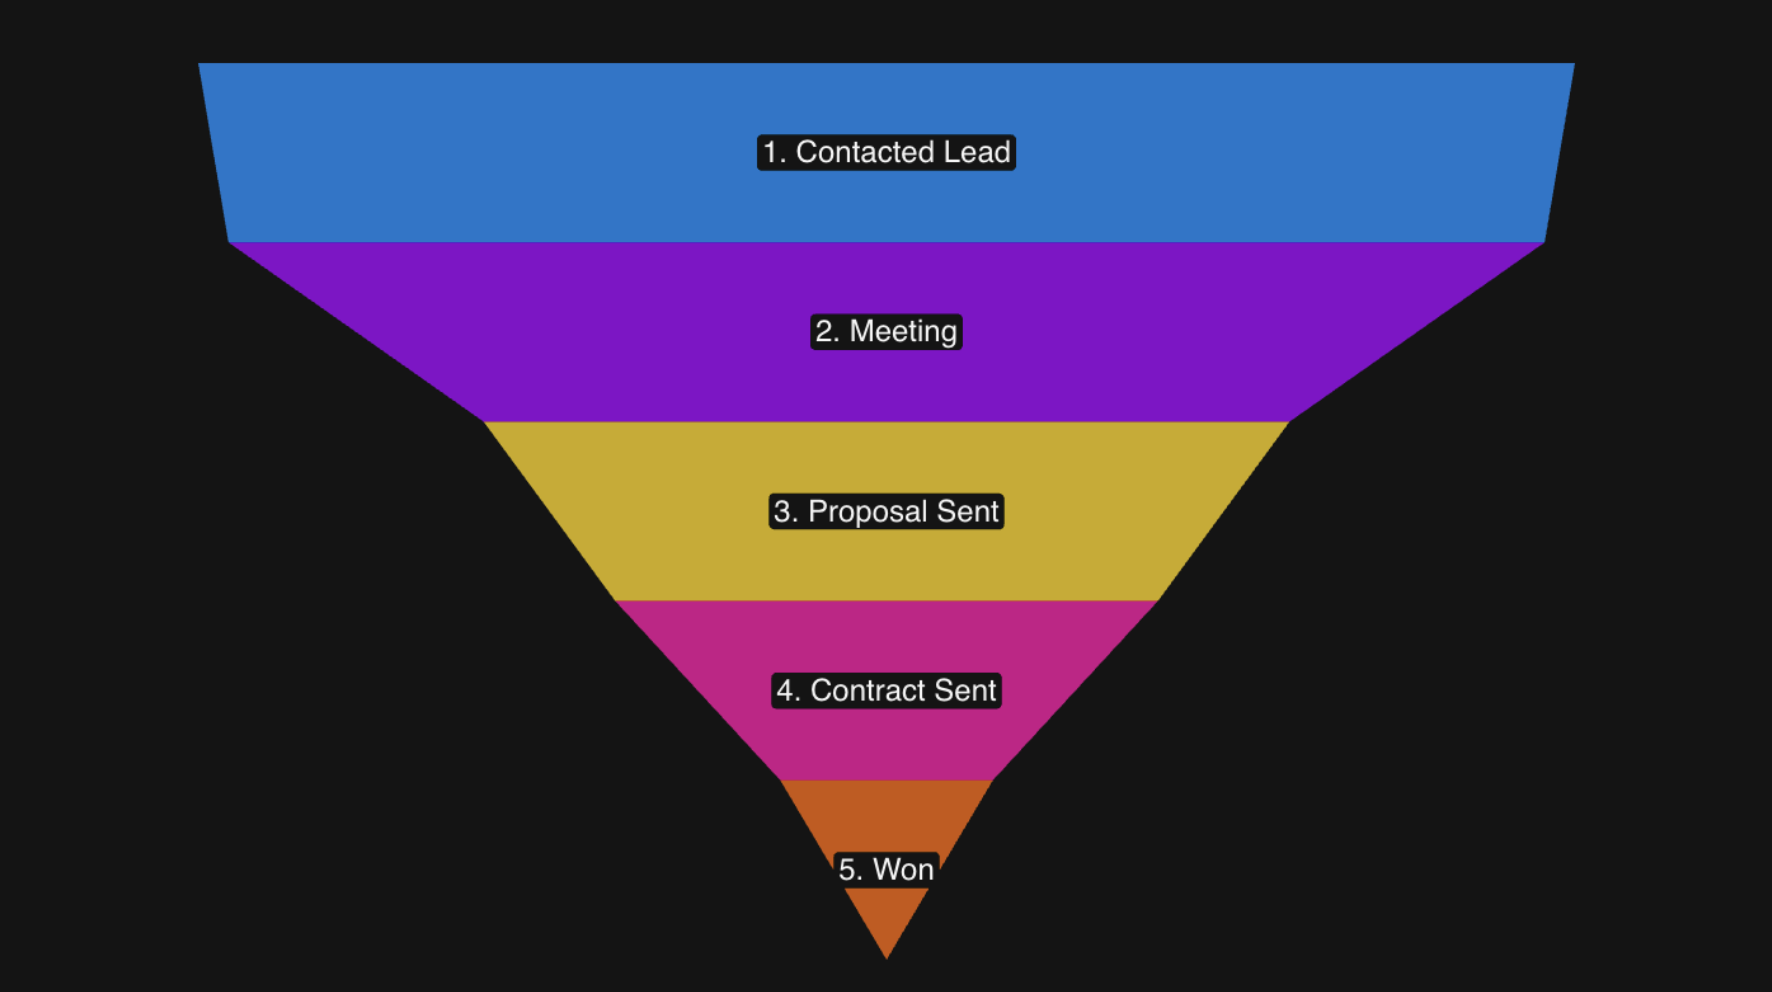
In Attio, these transitions depend on clean Deal stages, well-defined qualification rules, and consistent Activity tracking (calls, demos, proposals). Improving any stage, by generating more qualified People, increasing win rate, or tightening sales cycle length, compounds downstream, making revenue more predictable.
Example 2: Product-Led Sales Funnel (Hybrid)
In a hybrid motion, the funnel blends behavioral data with human action. Product usage signals identify who’s ready, while sales outreach drives what happens next:
Activated Users → Product-Qualified Leads (PQLs) → Sales-Qualified Leads (Deals) → Closed Won
Here, the funnel measures how product engagement converts to revenue:
- Activation → PQL: How well your product creates signals of intent.
- PQL → SQL: How effectively sales acts on those signals.
- SQL → Closed Won: How well qualified opportunities convert.
In Attio, this means linking Users and Companies to Deals, enriching records with product telemetry, and triggering Activities when usage thresholds are hit. But because product data is volatile and time-based, Attio alone isn’t enough. A data platform like Definite should serve as the source of truth, preserving historical context and powering funnel analysis across systems.
Why Funnels Matter
Funnels aren’t static dashboards. They’re feedback systems. Each stage is a variable you can influence, and every improvement compounds the next. Whether your funnel is built on conversations or product usage, the goal is the same: connect your operational data tightly enough that every stage of growth can be measured, optimized, and repeated.
Funnels show how customers progress; segmentation shows who progresses fastest, and why.
Segmentation and Diagnosis: Finding Leverage in the Details
Segmentation adds focus. It turns averages into insight. By breaking your metrics into cohorts, you can see where growth actually comes from: which accounts convert faster, which users activate sooner, and which customers expand more predictably.
In Attio, segmentation isn’t a reporting trick, it’s how you diagnose your go-to-market system. Whether you’re running a sales-led motion, a product-led motion, or a hybrid of both, meaningful segmentation comes from the same principle: connecting structured data (Company, People, Deals, and Users) to behavioral context (activity, usage, lifecycle stage).
Common Segmentation Dimensions
| Dimension | What It Means | Example Question It Answers |
|---|---|---|
| Qualification Criteria | Group by ICP fit, lead score, or company attributes like industry or size. | Do high-fit Companies convert at a higher rate or move through the pipeline faster? |
| Deal Stage or Lifecycle Stage | Group by sales or product journey (e.g., demo requested, trial active, activated user). | At which stage do Deals tend to stall–qualification, negotiation, or expansion? |
| Product Tier | Segment by pricing plan or usage level (e.g., free, trial, team, enterprise). | How does Activation Rate differ between free and paid Workspaces? |
| Engagement or Activity Score | Group by recency or frequency of touchpoints (sales calls, emails, logins, sessions). | Are People with more than three Activities or Users with daily logins more likely to convert? |
| Behavioral Intent Signals | Segment by actions that imply purchase intent (usage spikes, hitting plan limits, feature adoption). | Which Users or Companies are showing early signs of expansion? |
Example
If your overall win rate is 30% but rises to 45% for high-fit Companies that engaged with three or more Activities before a demo—that’s leverage. You don’t need new metrics, just sharper focus on where your system already works.
Segmentation transforms your CRM data from a dashboard into a diagnostic tool, shifting analytics from describing performance to directing it.
Forecasting: Turning the Funnel Forward
Everything so far looks backward—what converted, who performed, where deals stalled. Forecasting is that same machinery pointed forward: taking the open pipeline and projecting how much of it becomes revenue, and when.
Most founders forecast one of two ways, and both are shaky:
- Sum the open pipeline. Total every open deal. This is optimistic fiction—it assumes everything closes.
- Stage-weighted pipeline. Multiply each deal by a win probability for its stage ("Demo" = 20%, "Contract Sent" = 80%). Better—but only as honest as those probabilities, and the defaults are usually invented.
The version you can defend to a board is conversion-based forecasting: instead of guessing stage probabilities, you derive them from your own history. If deals that reach "Contract Sent" have historically closed 72% of the time, that's your weight—and it's a number you can stand behind. The segmentation from the last section makes it sharper: high-fit and low-fit Companies don't convert at the same rate, so they shouldn't carry the same forecast weight. Fold in Sales Cycle Length and you get timing, not just amount—which quarter the revenue actually lands in.
Then you pressure-test the forecast against reality. Your Closed Won deals live in Attio; the cash that actually arrived lives in Stripe. A forecast you trust is one you can reconcile against billing—and the gap between "closed" and "collected" is one of the most useful signals you have.
Here's the catch, and it's the one this guide keeps circling back to: good forecasting runs on history, and Attio doesn't keep it. Conversion-based weights depend on knowing how deals moved between stages over time—exactly the transitions Attio overwrites the moment a property changes.
Once you’ve found the segments that perform best, the next question is whether your data can actually prove those patterns over time.
What could your CRM data tell you?
Enter your domain and we'll show you the revenue and retention questions your CRM data can answer when it's connected to everything else.
Try it with any company domain — no signup required.
Data Management: From Metrics to Measurable Data
By now, the structure is clear: metrics, equations, and segments give you the language for understanding growth. But to make those metrics real, you need the data underneath them.
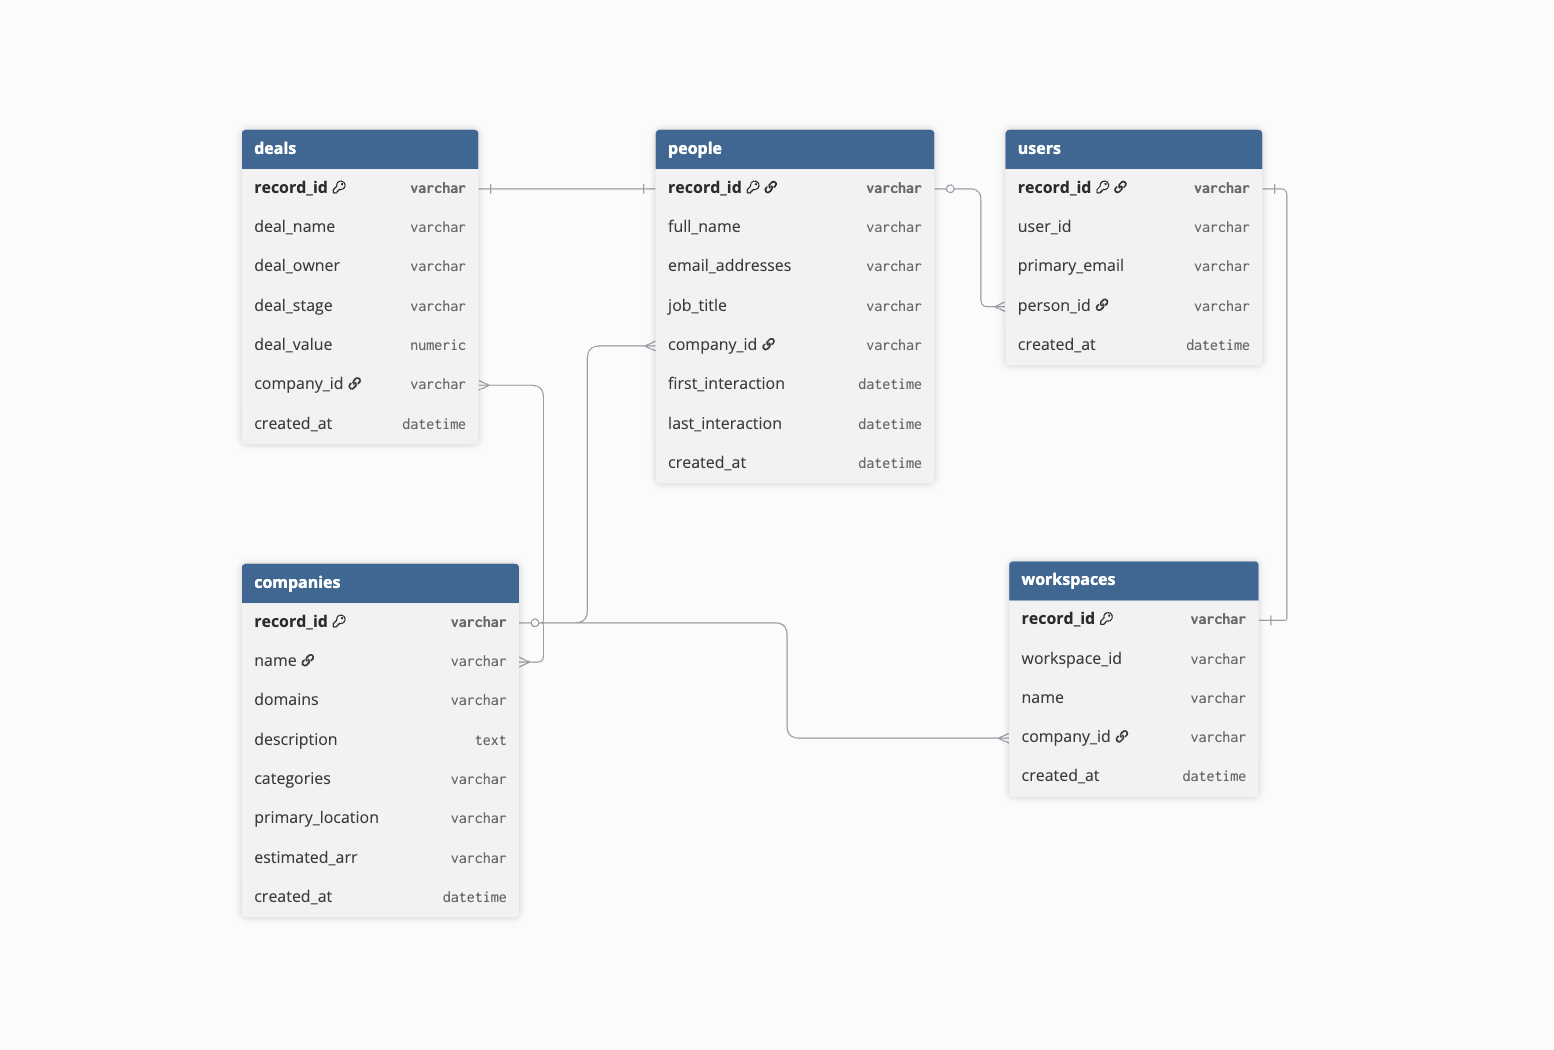
Attio's data model is built for clarity: People, Companies, Users, Workspaces, and Deals. It captures what's happening right now—every contact, opportunity, and interaction neatly organized.
That's what makes Attio such a strong operational system. But analytics needs more than snapshots of "what is." It needs a record of "what changed."
What Attio Captures Well
Attio’s native reporting handles simple, creation-based metrics naturally:
- Leads created over time
- New users added (for PLG-style funnels)
- Deals opened or closed in a given period
That gives you a clean, current view of your pipeline (the what behind your growth motion.)
Where It Starts to Break Down
Some metrics depend on transitions, not just creation. You need to know when something changed, not just that it did.
For example, tracking conversion rates requires knowing when a User upgraded from free to paid, or when a Deal moved from “Contract Sent” to “Closed Won.”
Attio overwrites records instead of preserving state. Once a property updates, the previous state and its timestamp are gone. That makes it difficult to analyze funnels over time or measure how long records spend between stages.
It’s also limited across objects. You can’t easily connect People → Companies, or Companies → Deals, to analyze how leads progress through the broader funnel from marketing to sales. Without persistent event history or cross-object relationships, those transitions disappear.
In short: Attio is great at showing what exists now, but not how it got there. It’s an operational system of record, not a historical system of change.
Bringing Business Context from Beyond the CRM
Even if Attio captured every transition, your richest growth signals live outside the CRM:
- Product data (usage, activation, retention)
- Payment data (billing events, renewals, upgrades)
- Other customer records (email and customer support interactions)
Integrations can help, but they're brittle. Each system speaks its own language. That's why the real unlock is centralizing data.
Where Definite Complements Attio
This is where a data platform like Definite comes in. By centralizing your CRM and over 500 other data sources, you get both structure and history—everything Attio needs to become a true growth system.
Definite can:
- Preserve historical changes as time-stamped events rather than overwriting them.
- Merge Attio’s operational data with product, financial, and marketing signals from systems like Stripe, QuickBooks, and your application database.
- Build funnels that hold up over time, showing not just how many users converted, but when and how they moved through each stage.
That means you can finally measure what Attio alone can’t:
- Time from signup → activation → paid
- Which deal stages slow down or accelerate
- How product behavior correlates with pipeline outcomes
And it’s not just one-way. Once metrics are modeled and calculated in Definite, like lead scores, product usage tiers, or churn risk, they can be synced back into Attio automatically.
That turns your CRM into a live, data-enriched workspace: every Person, Company, and Deal is continuously updated with real performance signals.
Attio gives you structure and visibility. Definite adds history, enrichment, and intelligence.
Together, they transform CRM analytics from reporting what happened to understanding why it happened, decide what to do, and even take the next action.
Building a System for Continuous Measurement and Improvement
Once that foundation is in place, the next step is making analytics part of how you operate— not a project, but a habit. That's where continuous measurement comes in.
From Insight to Experiment
Analytics is only useful if it changes behavior. The goal isn't more dashboards, it's better decisions, made faster. Every metric should spark a question:
- If win rate dropped, why?
- If activation increased, what caused it?
- If expansion slowed, which customers changed first?
Those questions drive experiments—tweaks to messaging, onboarding, or outreach—that feed back into your CRM and shape how your business grows.
Operationalizing Feedback Loops
Once you're asking better questions, Attio becomes the execution layer:
- Create segments - high-fit prospects, inactive users, churn-risk accounts
- Assign scores - lead quality, engagement, expansion potential
- Trigger actions - outreach sequences, success follow-ups, retention plays
Each action generates new data—activity logs, responses, conversions—that refresh the underlying metrics. That's the feedback loop in motion: Data → Insight → Action → Data.
The Analytics Flywheel
With Definite as your analytical backbone, that loop becomes a flywheel, compounding with every cycle:
- Capture operational data in Attio
- Sync and enrich via Definite
- Analyze metrics and identify levers
- Act on insights through Attio workflows
- Measure and refine the model
Each loop compounds your understanding. Your CRM stops being a static record of what happened, it becomes a system that learns and adapts.
Engineering Growth with Attio and Definite
Attio is powerful because it's flexible. It doesn't dictate how your business grows, it mirrors your strategy.
Paired with a data layer like Definite, it becomes more than a CRM. It becomes the control system for your company's growth—a single feedback loop connecting every customer touchpoint, every metric, and every improvement over time.
That's how you move from managing relationships to engineering growth.
Founder to Founder,
I’d love to show you what you can do with your CRM data (and all your other data too.) Let’s setup some time to talk.