Analyzing data in ChatGPT like your job depends on it

You’ve got Stripe and Salesforce exports piling up in your Downloads folder and investor updates that need numbers yesterday. You know how to organize the data in a spreadsheet, but you’d rather chew on glass. You don’t have a data team, and learning Python this weekend isn’t happening.
You figure, ”I’ll try ChatGPT.” It basically made dinner last night, and it wasn’t bad! It’s worth a shot…
That’s why I created this guide. It’s written for execs who need answers yesterday and can handle a spreadsheet, but stop short when someone says join or cohort analysis.
Stick with me for a few minutes, and you’ll see how to do advanced data analysis with just ChatGPT and a CSV file. Ask plain-English questions and get charts and insights you can trust, or at least challenge intelligently. 😀
I’ll run you through a live example you can follow on your own, flag hidden tripwires, and show you when it’s time to consider a more advanced solution.
All you need before diving in is a reasonably clean CSV or Excel file and a bit of curiosity about your own numbers. No code, no BI license, just your browser and (optionally) a cup of coffee.
Let’s get into it.
Let’s do an analysis
I’ll be using an easy-to-access dataset for this guide called “Sample Superstore Sales” (sometimes called “US Superstore”). It’s freely available on Kaggle as a single CSV file and contains realistic order-level information you’d expect to see in a young SaaS or e-commerce business:
| Column examples | How we can use it |
|---|---|
| Order Date, Ship Date | Time-series trends, cohort analyses |
| Customer ID, Segment, Region | Simple customer segmentation |
| Category, Sub-Category, Product Name | Product/feature drill-downs |
| Sales, Quantity, Discount, Profit | Revenue, margins, unit economics |
Because it’s small, ChatGPT’s data-analysis mode can load it instantly, and the field names are human-readable.
It’s also been used in BI tool training and countless blog posts, so you’ll find plenty of reference material if you want to dig deeper.
How to grab it
-
Visit the Kaggle page for “Superstore Dataset – Final.” (Kaggle)
-
Click Download, then unzip the file. You’ll get a plain
Superstore.csvyou can drag into ChatGPT’s file-upload box.
(Kaggle accounts are free; the dataset is released for educational use.)
Tip: If you already have your own spreadsheet, follow along with that instead. The prompts below work as long as you have date, customer, product, and revenue columns, even if the column names differ slightly.
Load the file and ask your first question
-
Open a new ChatGPT chat and switch to Data Analysis mode.
-
Drag-and-drop
Superstore.csv. ChatGPT will say something like “I’ve loaded a file with 9,994 rows and 21 columns.” -
Copy-paste the first prompt below.
Prompt:
Give me a one-paragraph executive summary of the business performance in this file.
Highlight: total sales, total profit, overall gross margin, and the time period covered.
And you should get back something like this:
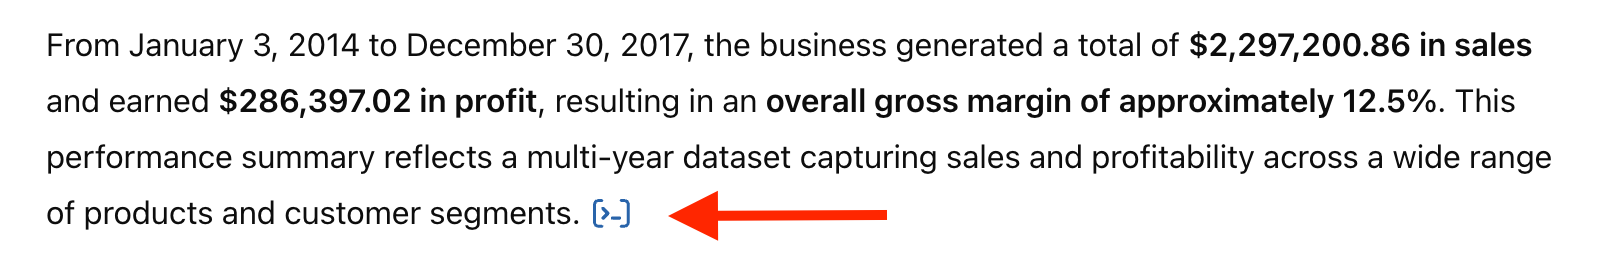
From January 3, 2014, to December 30, 2017, the business generated a total of $2,297,200.86 in sales and earned $286,397.02 in profit, resulting in an overall gross margin of approximately 12.5%. This performance summary reflects a multi-year dataset capturing sales and profitability across a wide range of products and customer segments.
What’s happening behind the scenes?
-
File parsing. ChatGPT recognizes your file type, samples a few thousand rows, infers data types (dates, numbers, text), and loads it into a Python in-memory data frame.
-
Natural-language translation. Your plain-English request is converted into Python code under the hood. If you want to see the code, click on the blue [>_] at the end of the reply:
-
On-the-fly visualization. If a chart or graph is needed, ChatGPT calls a Python charting library to render a PNG that appears inline, as we’ll see below.
-
Statistical helpers. Need a trend line or a quick regression? ChatGPT can automatically import SciPy or statsmodels. You ask, it decides.
Knowing this matters for two reasons:
1. You can trust the fundamental tools (the underlying libraries are battle-tested).
2. You can ask deeper questions (anything those libraries can do, a well-phrased prompt can trigger).
What types of analyses can you do?
Before we get to the core questions every founder should ask, let’s look at the kinds of data mashing ChatGPT can handle for you without formulas or functions, just plain English.
- Clean and reformat messy columns by renaming headers, fixing weird date formats, or dropping blanks. You can’t escape it, so you might as well do it the easy way.
- Filter, sort, and rank rows by whatever matters like dates, top regions, or biggest spenders.
- Pivot and reshape your data to stack up metrics across categories, customers, or channels.
- Summarize and aggregate metrics like total sales, average margins, or order counts over time.
- Visualize trends with simple charts, rolling averages, or quick forecasts.
- Spot outliers like giant discounts, late shipments, or unusually profitable customers.
- Export your findings as images or slides so you can share without redoing the work.
What types of analysis should you probably not do?
You don’t have to take my word for it, but if you try any of the following operations, your mileage may vary. I wouldn’t use ChatGPT to…
- Join large datasets. The LLM is likely to get confused, misalign keys, or quietly skip rows. It’s not your warehouse replacement.
- Handle big files and you’ll hit invisible limits. Anything over ~50MB or 50k rows may get sampled or silently cut off.
- Run complex SQL logic or pipelines like multi-step joins, window functions, or subqueries, and results may be slow, wrong, or both.
- Remember past steps. You’ll need to remind it. ChatGPT doesn’t always retain filter logic or metric definitions unless you spell it out.
- Keep a paper trail. There’s no saved code or version history. Close the tab, lose the work.
Note: ChatGPT is not a BI tool, data warehouse, or data platform
ChatGPT is great for quick, one-off explorations but it’s not your long-term data infrastructure. There’s no “refresh” button, no dashboards, and no shared workspace. Every analysis is a one-time thing.
In other words, it’s fine for the one-off upload file, ask question, get answer report (unless you care about data privacy and security), but it's definitely not a scalable solution.
It also doesn’t replace a data warehouse. If you’re stitching together data from Stripe, HubSpot, and Postgres or need a reliable source of truth over time, then you’ll want something purpose-built for that.
It also bears repeating: think twice before uploading sensitive data. Everything goes to OpenAI’s servers. If compliance matters or if multiple teammates need to access, audit, or build on your analysis - you’re going to hit walls fast.
And in case it’s not apparent, Definite, the publisher of this article, is an AI-native data platform.
Ok, now that the disclaimers are out of the way. Let's get back to the analysis.
Five power-user tips (stuff most blog posts omit)
-
Rename columns inside the chat. If ChatGPT misreads a header, just say:
“RenameSalestoRevenueeverywhere, then redo the profit table.” -
Chain analyses. Reference previous outputs by name:
“Using the cohort grid you just built, calculate 3-month LTV for each cohort.” -
Export your findings. End with:
“Save the two charts above and the summary table to a PowerPoint.”
ChatGPT will give you a download link. -
Stay under the memory cap. Upload one file at a time or filter rows first—e.g., only last 24 months—so the model doesn’t hit token limits.
-
Validate surprising results. Ask:
“Show me the raw rows that drive the 42 % margin in Office Supplies—does that look right?”
Core data analysis questions every founder should ask
Here are some plug-and-play prompts you can copy together with the results you’ll get. I’m providing these prompts as examples, but my goal is for you to get the feel of what you can ask on your own.
1. Goal
Find growth drivers
Prompt:
Show monthly sales broken down by product Category and point out the fastest-growing line in the last 12 months.
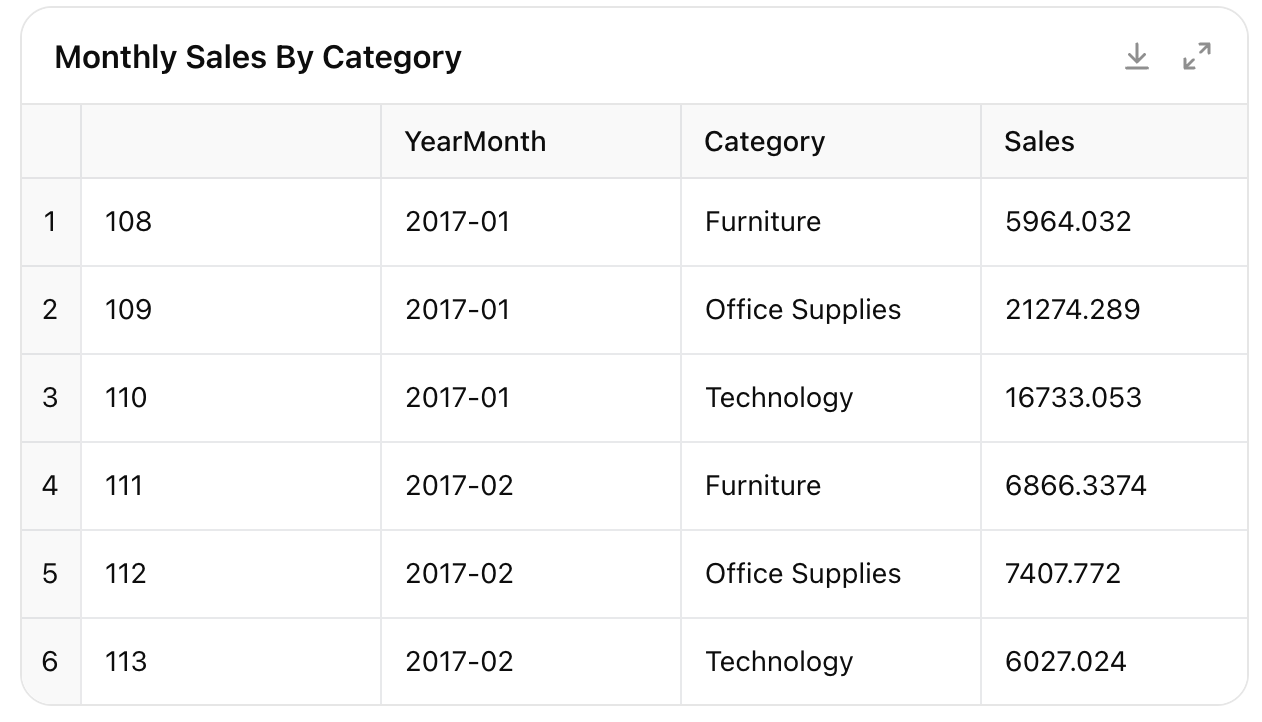
The fastest-growing product line in the last 12 months was Furniture, with a sales increase of $25,443.43 over the period. This outpaced growth in Office Supplies and Technology. You can explore the monthly sales breakdown by category in the table above.
Follow-up prompt:
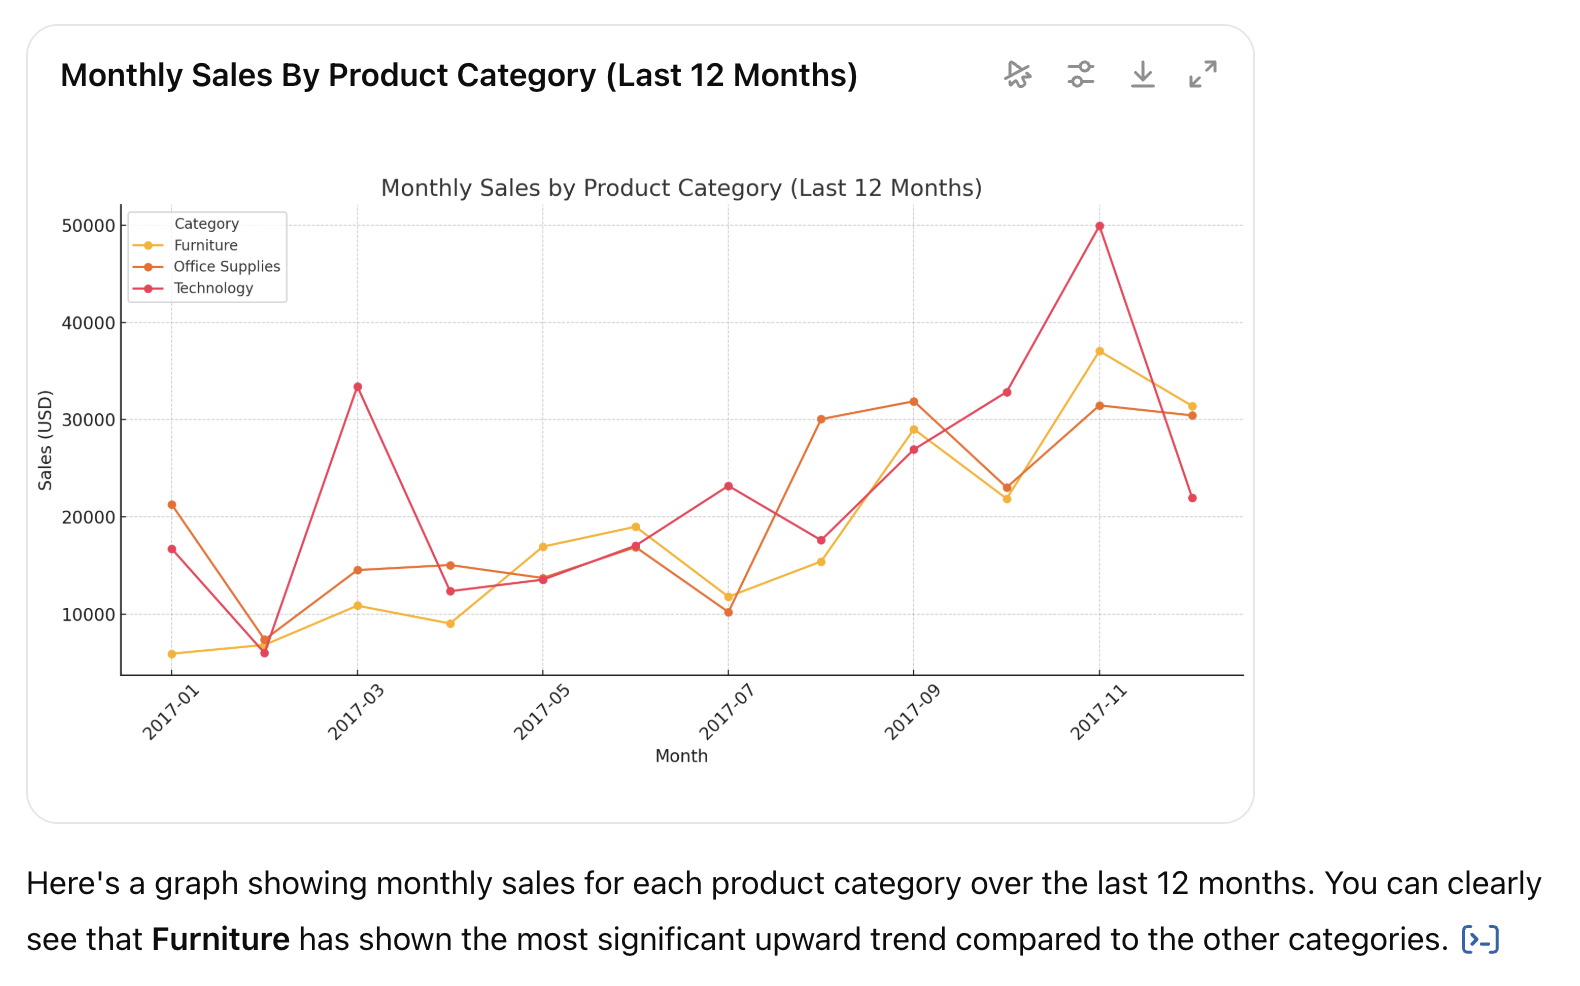
Show me the above data as a graph
2. Goal
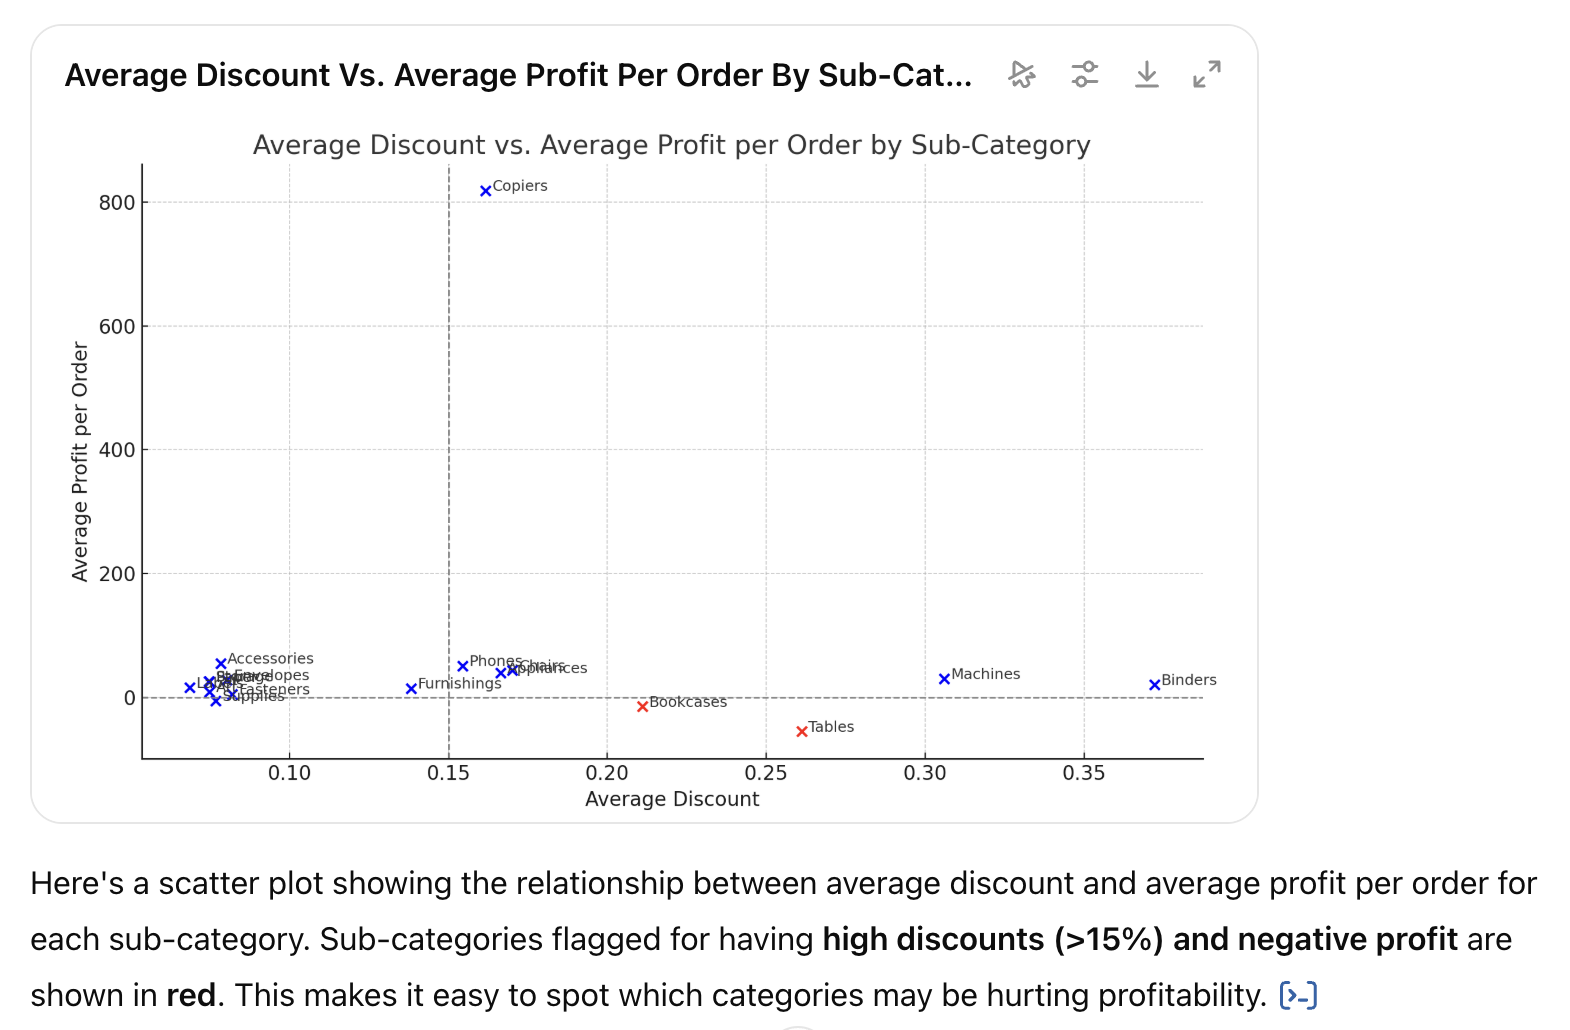
Spot margin leaks
Prompt:
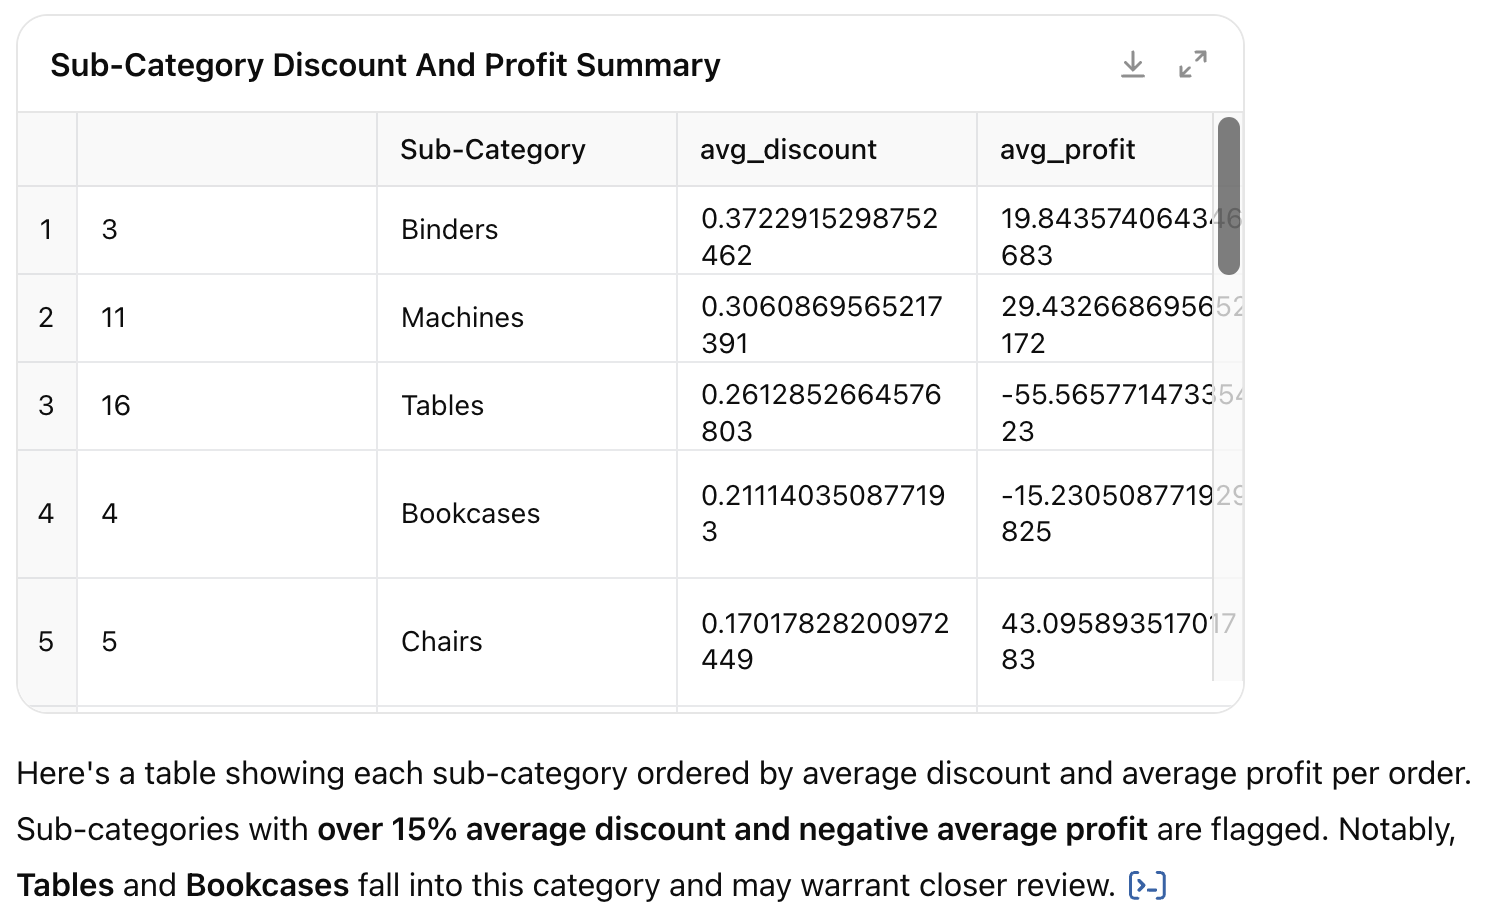
Give me a table of Sub-Category ordered by average discount and average profit per order. Flag anything with >15 % discount and negative profit.
Follow-up prompt:
Show me the above data as a visualization and pick the best way to show the data
3. Goal
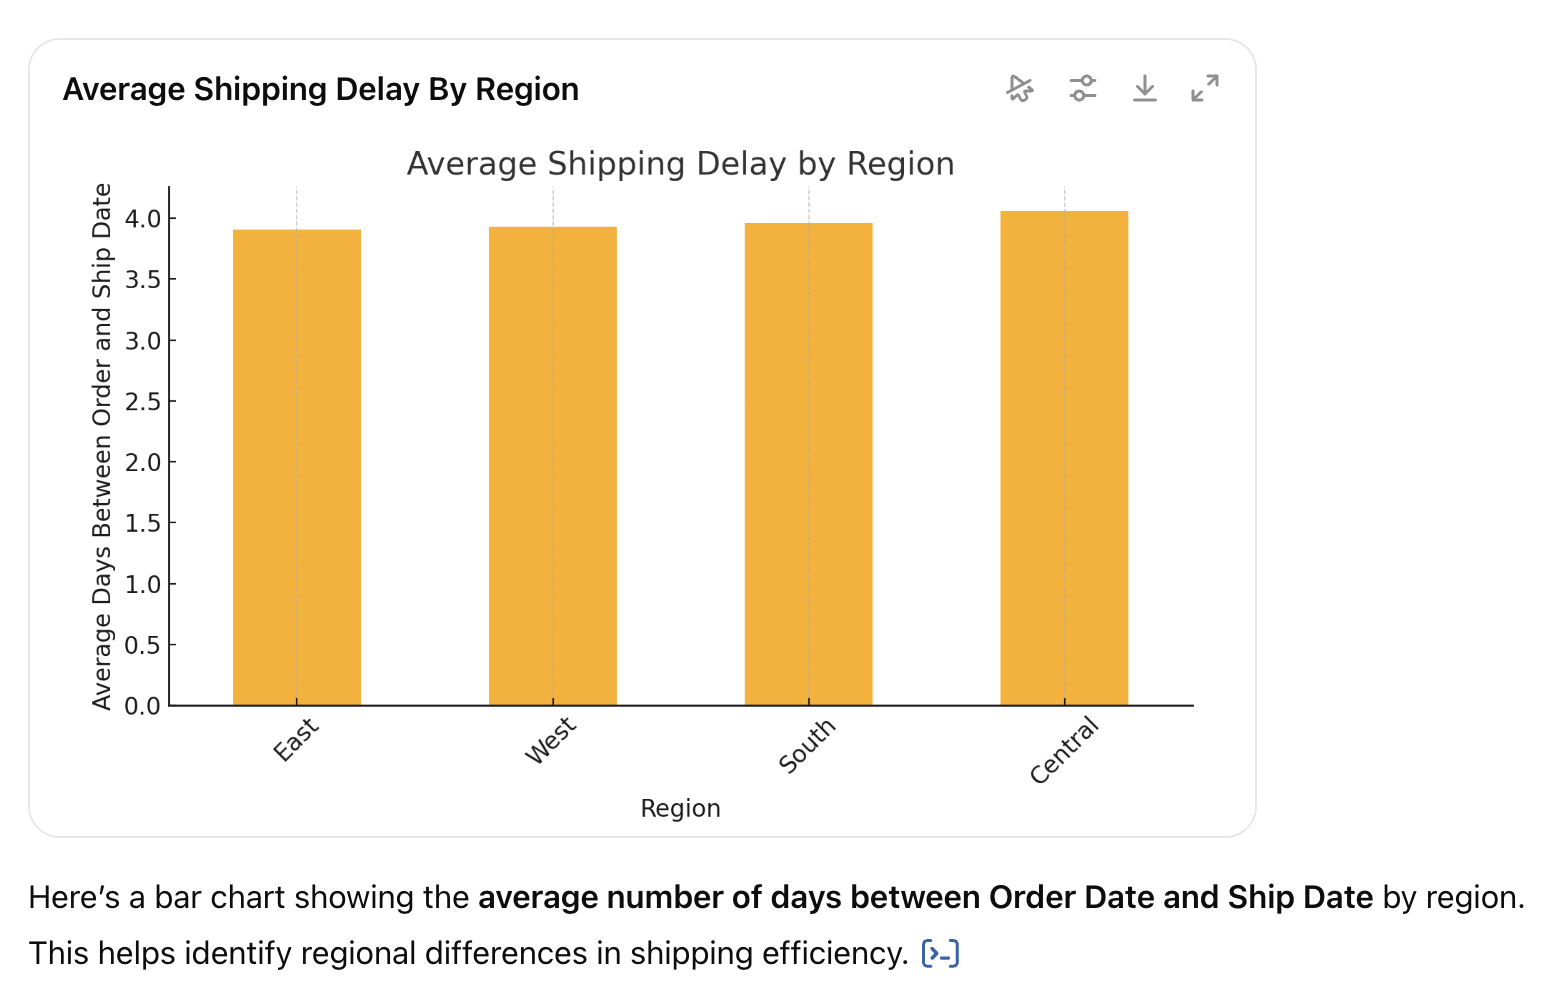
Check shipping delays
Prompt:
Compute average days between Order Date and Ship Date by Region. Display as a bar chart.
4. Goal
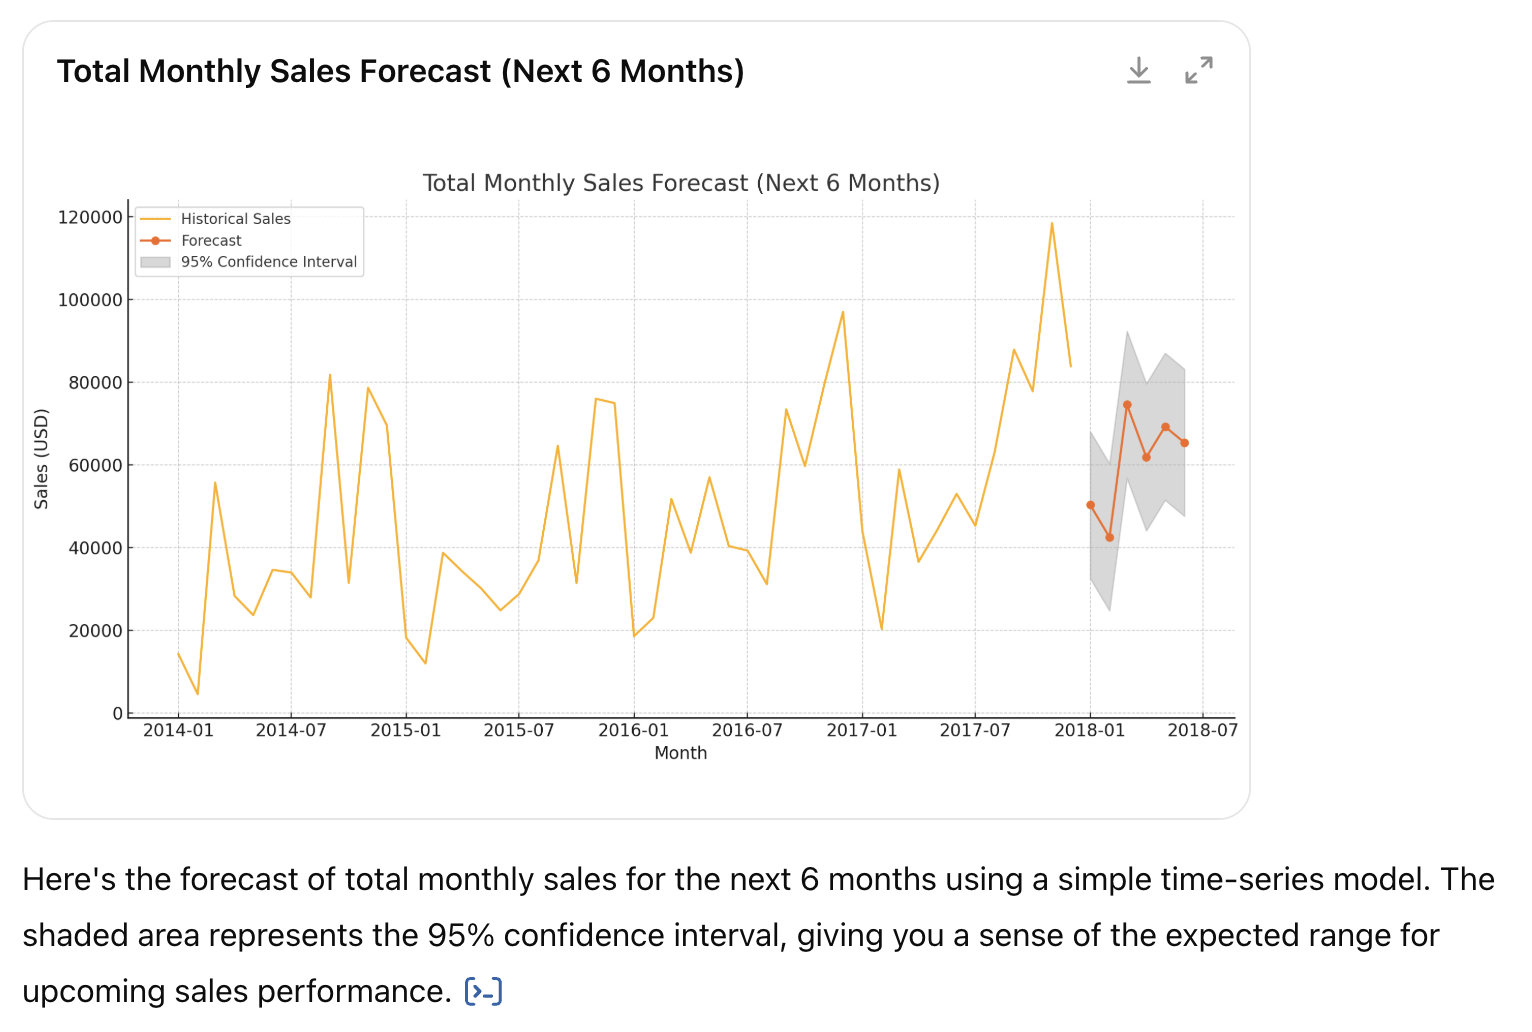
Run a quick forecast
Prompt:
Forecast total monthly sales for next 6 months using a simple time-series model and show the confidence interval.
Goal
Export to a deck - ChatGPT can use Python libraries to export the data to PowerPoint (if you must).
Prompt:
Save the two charts above and the summary table to a PowerPoint.

Common gotchas & how to avoid them
| Problem | Why it happens | Quick fix |
|---|---|---|
| Dates treated as text | Exported CSV wrapped dates in quotes | “Convert Order Date and Ship Date to true dates, then continue.” |
| Duplicate column names | Two systems export ID columns | “Rename the second ID to Product_ID.” |
| Silent truncation | File > 50 MB; model samples rows | Upload a filtered subset or group at source first. |
| Vague prompt, vague answer | Asking “Show insights” | Be specific: metric + dimension + time frame + format. |
Know your limits
While dragging a CSV into ChatGPT feels like a super-power, remember what’s actually happening.
The moment you upload your file, every row: names, margins, maybe even credit-card fragments, gets sent to OpenAI’s servers. If you’ve got GDPR obligations or just a healthy sense of paranoia, that little shiver you feel is your instincts firing.
Then there’s the audit trail that isn’t.
ChatGPT writes Python under the hood, but the code lives only inside the chat window. Close the tab, lose the breadcrumbs. When a teammate circles back next quarter and asks how you calculated gross margin, you’ll be scrolling through a wall of conversation looking for half-remembered prompts.
And because the model can change whenever OpenAI tweaks it, the same prompt next week might spit out a slightly different answer. Good luck reproducing last month’s board slide.
Collaboration turns clunky pretty fast.
You can’t share a live link the way you would with a “real” dashboard, and there’s no “schedule refresh” button. Want to blend your order history with Stripe payouts or a “users” table in Postgres? You’ll be exporting, copying, and pasting like it’s 2005.
Every update means another manual download, another upload, another chance to fat-finger a filter. Automation? Not unless you’re happiest living in Zapier spaghetti.
After a while, it all starts to feel a lot like working in a giant spreadsheet again. Quick to explore, terrifying to scale. Data goes stale, formulas hide in cells no one remembers, and the moment you hand it off, the context evaporates.
ChatGPT makes the first mile of analysis thrilling, but for anything mission-critical, sooner or later you’ll need a proper solution with data ingestion, storage, sharing, dashboards, automations, etc.
Here’s what you really need
But first, some background.
I have a degree in comp-sci and have personally built the data analysis solutions for several startups from scratch. It always involved spending a significant chunk of time getting it set up and I was often finessing the process to make sure it ran smoothly.
The fact that today you can upload a CSV file to ChatGPT, ask it questions in plain English, and have ChatGPT create Python code to do the analysis is truly mind-boggling. This was science fiction just a couple of years ago.
But it's still just a piece of the puzzle and not an entire solution.
That's why I was so excited when I came across Definite, the data analysis solution I wish I had back then.
Instead of needing to be a part-time data engineer, Definite provides a single platform that already knows how to fetch data from Stripe, HubSpot, and whatever else you’re running, land it in a warehouse you control, clean it up, and surface it through dashboards or plain-English queries.
Welcome to the future 🙂
And you keep ownership of the underlying infrastructure, so security audits go smoother and you’re never hostage to someone else’s walled garden.
Everything is automated and just works: New transactions flow in overnight, pipelines run while you sleep, and the numbers you wake up to are always current.
But Definite isn’t just plumbing.
There’s an AI layer on top that lets non-technical teammates poke around without SQL, and because everything sits in the same stack, answers line up with the single source of truth the finance team relies on.
No more “why does your report disagree with mine” chats.
And if you don’t have a dedicated data engineer, you can add Definite’s fractional data team service for a few hours a week. It’s like renting a senior analytics brain until you’re ready to hire your own, then dialing the engagement down when you don’t need it anymore.
So go ahead and keep ChatGPT in your toolkit for quick, one-off explorations. When it’s time to turn that insight factory into something repeatable, secure, and shareable, hand the keys to Definite and get back to building the product your customers pay you for.
The best part? You can get up and running in a matter of days. Seriously.
Ready to see what Definite can do for you?
Book a technical demo and get your stack running this week.