Tracking AI Agent Performance with Logfire and Ducklake

How do you track AI agent performance?
Here I’ll do a deep dive into how we track our AI agent at Definite. This involves three parts: extracting AI agent logs into a data lake, modeling the log data for analysis, and building the reports and charts necessary to track our agent's performance.
Tracking AI Agent Logs with Logfire
It seems like every company has an AI agent nowadays. At Definite, we’re no exception. Our AI agent is built to be an all-in-one data engineer/analyst: it turns questions into SQL queries; runs queries based on a Cube semantic model; analyzes failed queries; helps you integrate new data sources; fetches the status of data syncs; and a lot more.
But as you can imagine, having an agent that can run database queries leaves a lot of room for error. Sometimes the agent will fall down a rabbit-hole when trying to answer a complex question, and won't let up until it hits our maximum LLM call threshold. Other times the agent may uncover errors in the underlying data model, and get confused as to why queries are failing.
Thus we needed a good way to monitor our agent in order to continue to refine its architecture and uncover bugs. We want to know what tools it’s calling and with what arguments, how many tool and LLM calls it’s making to answer each query, whether it’s running into errors, and how satisfactorily it’s answering user's questions.
We also want to keep track of the input and output tokens our agent is using when making LLM requests, to help us minimize cost while maximizing utility.
We use Pydantic AI for our AI agent framework to help validate and structure model outputs. Pydantic Logfire is a logging tool that integrates with Pydantic AI, giving us visibility into all the LLM and tool calls our agent is making.
Logfire has a nice built-in dashboard to explore your agent logs, but it lacks the flexibility to produce the kind of reporting we needed. So we decided to load the logs into our own data lake in order to build custom dashboards and alerts.
Retrieving the agent logs from Logfire is straightforward: just grab a "read token" from Logfire (available in the Settings), and use it to query logs from their API. Here is a Python example of querying the Logfire API for some key data, like start and end times, input/output tokens, and "attributes", which contains the model request parameters. To run this code, you'll have to set the READ_TOKEN that you get from Logfire.
import requests

query = f"""
SELECT
r.created_at, r.start_timestamp, r.end_timestamp, r.duration,
r.trace_id, r.span_id, r.parent_span_id, r.span_name, r.message, r.is_exception,
r.exception_message, r.deployment_environment,
r.'_lf_attributes/gen_ai.request.model as model',
r.'_lf_attributes/gen_ai.usage.input_tokens' as input_tokens,
r.'_lf_attributes/gen_ai.usage.output_tokens' as output_tokens,
r.attributes
FROM records as r
where otel_scope_name = 'pydantic-ai'
order by start_timestamp desc

"""

params = {
    'sql': query
}

base_url = 'https://logfire-us.pydantic.dev'
headers = {'Authorization': f'Bearer {READ_TOKEN}'}

response = requests.get(f'{base_url}/v1/query', params=params, headers=headers)

# Check the response status
if response.status_code == 200:
    print("Query Successful!")
else:
    print(f"Failed to execute query. Status code: {response.status_code}")

lf_data = response.json()
Note (June 2026): Logfire later added a
POST /v2/queryendpoint that accepts a JSON body (and prefers amin_timestamp). TheGET /v1/querycall shown above still works and isn't deprecated, so this example is unchanged — but new integrations may prefer the v2 endpoint.
Loading Agent Logs into DuckLake
Now let's load these logs into DuckLake. DuckLake is my favorite place to analyze large data sets. It's a simplified Lakehouse that uses a standard SQL database for all metadata. It's as performant as Snowflake or Bigquery, but with an open format, Parquet, at the bottom. It lets you leverage the infinite scalability of cloud blob storage, as well as the ACID guarantees of traditional SQL databases, while avoiding vendor lock-in.
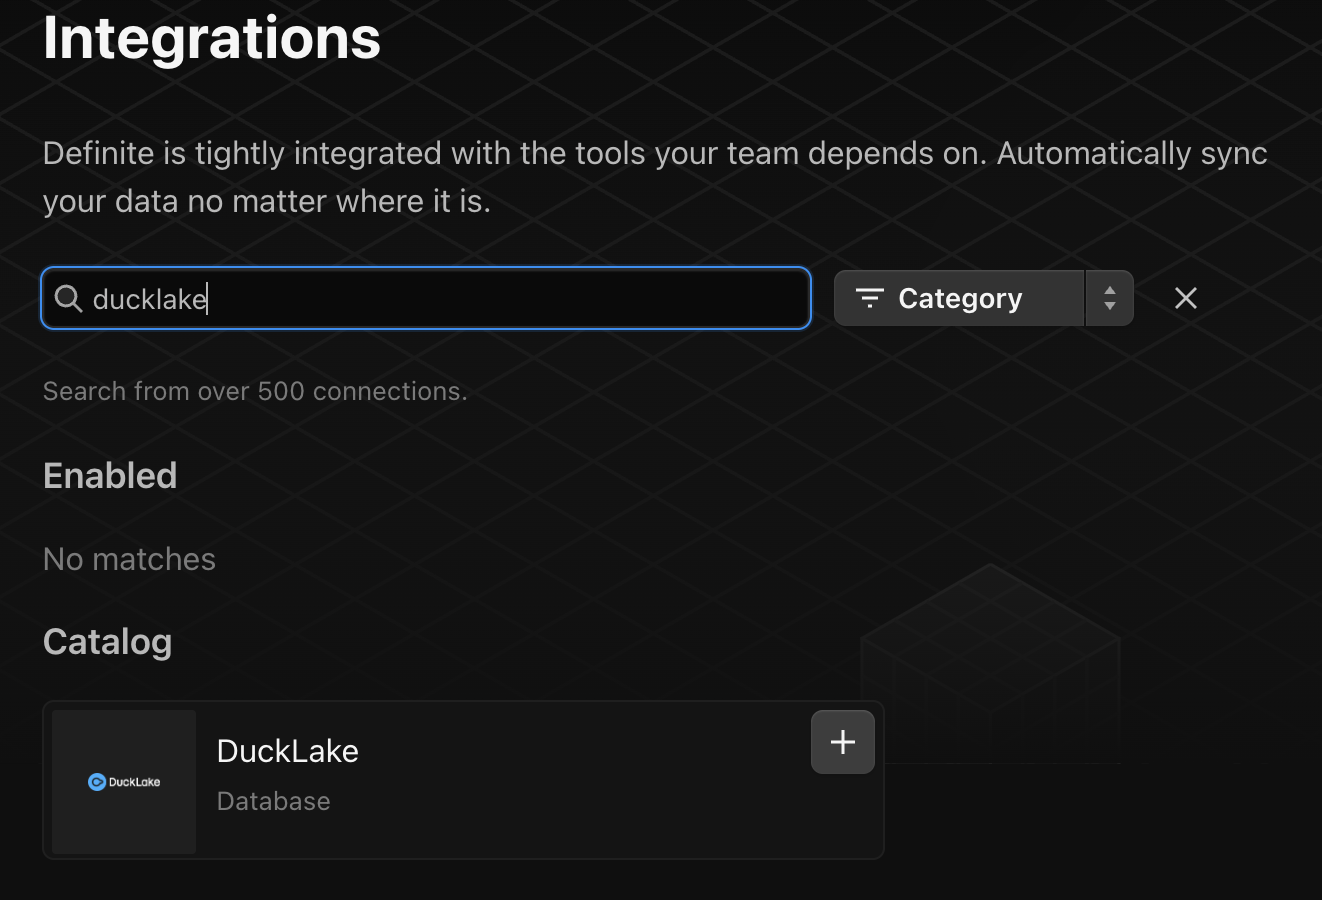
Setting up a DuckLake instance with Definite is easy. Just go to the integrations settings page, search "DuckLake", and add the DuckLake integration.
Loading Logfire data into DuckLake can be done in one simple Python script. Definite allows you to run and schedule python code with Python blocks. I’ll add my Logfire API token as a custom integration secret, and then connect and load the logs into DuckLake using the Definite SDK.
import requests
import pandas as pd
import duckdb
import json
from definite_sdk.client import DefiniteClient

conn = duckdb.connect()
client = DefiniteClient(os.environ["DEFINITE_API_KEY"])

conn.execute(client.attach_ducklake())

conn.execute("CREATE SCHEMA IF NOT EXISTS lake.logfire")
conn.execute("CREATE TABLE IF NOT EXISTS lake.logfire.ai")

#get logfire read token from integration store
integration_store = client.integration_store()
integration = integration_store.get_integration('Logfire Read Token')
READ_TOKEN = integration['secrets'][list(integration['secrets'].keys())[0]]

# get lf_data response object from Logfire API here

#transform logfire logs into dataframe for ducklake
lf_ls = []
for i in range(len(lf_data['columns'][0]['values'])):
    row_dict = {}
    for col in lf_data['columns']:
        row_dict[col['name']] = col['values'][i]
    lf_ls.append(row_dict)

lf_df = pd.DataFrame(lf_ls)

lf_df['attributes'] = lf_df['attributes'].apply(json.dumps)

# insert dataframe into ducklake table
conn.execute(f"""
INSERT INTO lake.logfire.ai
select * from lf_df
""")
After doing an initial load, I set up a scheduled Python block that incrementally inserts new logs into DuckLake. One way to do this without inserting duplicate records is to query from existing logs in DuckLake to find the max created_at timestamp and then only load logs that have been created since:
query = "select max(created_at) as created_at from lake.logfire.ai"
max_created_at = conn.sql(query).df()['created_at'][0]

query = """
select *
FROM records as r
where otel_scope_name = 'pydantic-ai'
and created_at > '{max_created_at}'::timestamp

"""

# then insert these incremental logs into the same table
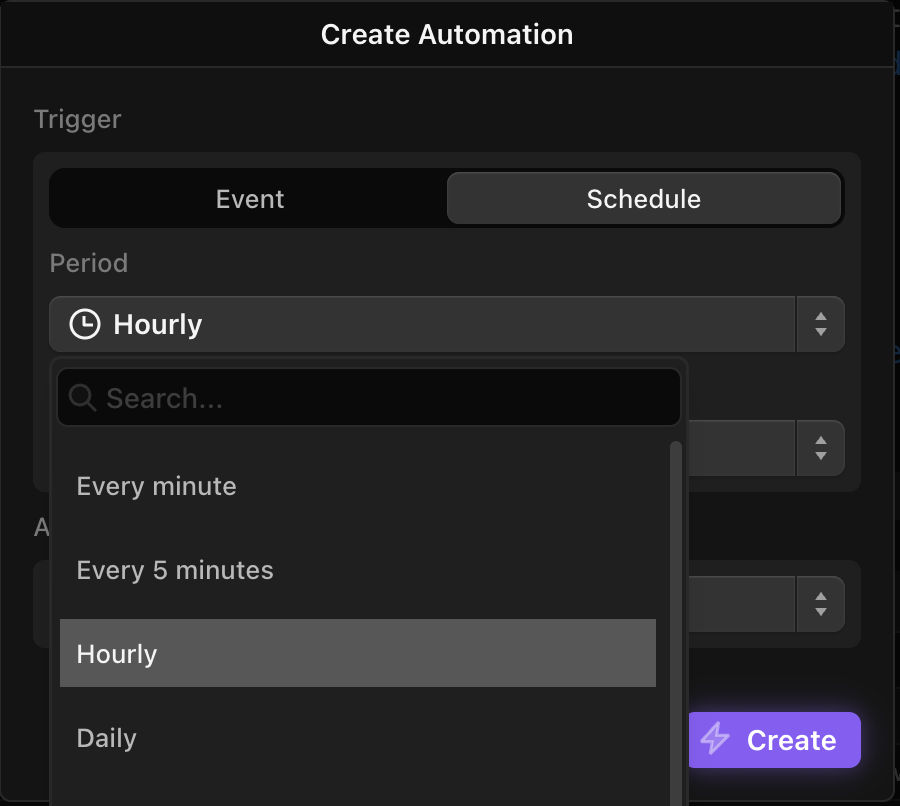
To schedule a block, click "Configure" and then "Add automation" in the right toolbar, and select the desired cadence (e.g. weekly, daily, hourly, etc).
Analyzing Agent Logs
Once the logs are loaded into DuckLake, we can start analyzing them.
The basic structure of Logfire logs is that each record is a "message" belonging to a thread. There is a unique trace_id for each thread, and a unique span_id for each message. The messages include LLM calls, tool calls, and an "agent run" message that contains a summary of the thread.
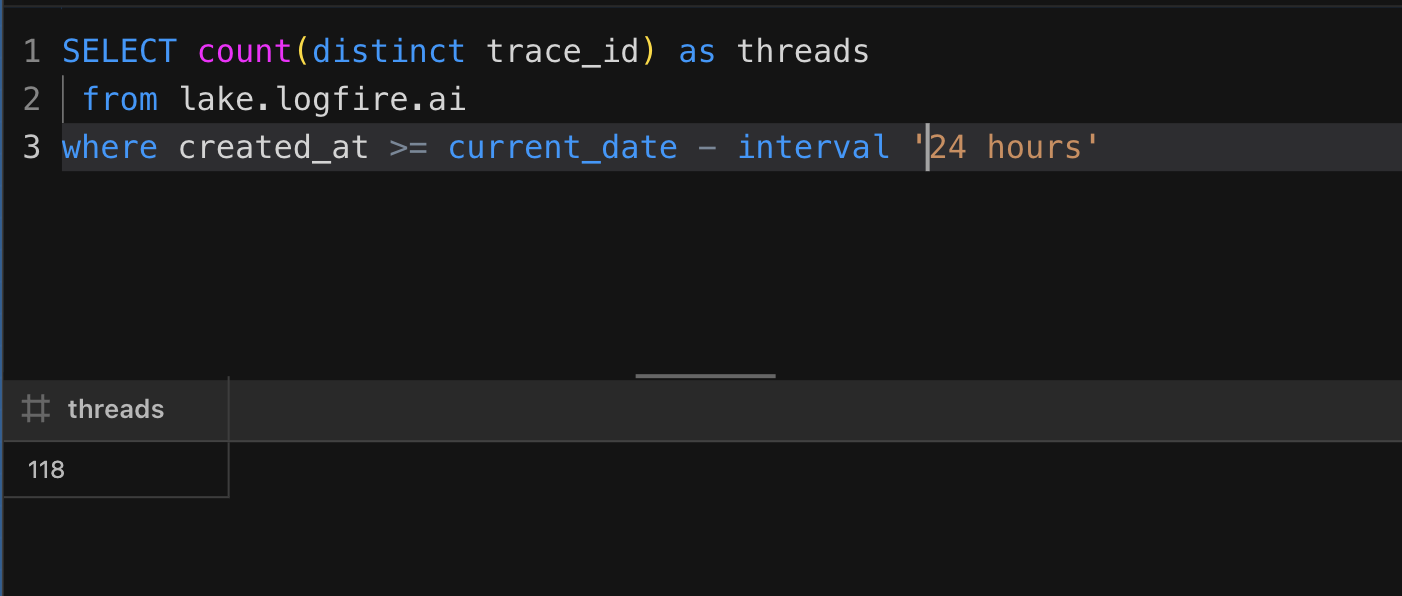
To get the number of unique threads over a period of time, say, the previous 24 hours, you can run a query like this:
SELECT count(distinct trace_id) as threads
 from lake.logfire.ai
where created_at >= current_date - interval '24 hours'
But instead of just writing custom SQL, let's create a Cube model for our logs. That will make them easier to explore and visualize without having to continue (re)writing SQL.
You can create a Cube model in Definite by clicking "Models" in the left toolbar and then clicking "Create Model" in the top right.
A model consists of a base query (here it’s just selecting all records from my logs table); dimensions, which are like columns with unique values for each record; and measures, which are aggregations over dimensions, like count, sum, avg, min, etc.
Here's a basic cube model with a dimension for Created At and a measure for Threads Count that counts the distinct number of trace_id's.
cubes:
  - name: logfire_ai
    description: Logfire Pydantic AI Logs
    sql: |
        select *
        from lake.logfire.ai

    refresh_key:
      sql: SELECT MAX(created_at) from lake.logfire.ai

    dimensions:
      - name: created_at
        sql: created_at
        type: time

    measures:
      - name: total_threads
        type: number
        sql: count(distinct trace_id)
        title: "Total Threads"
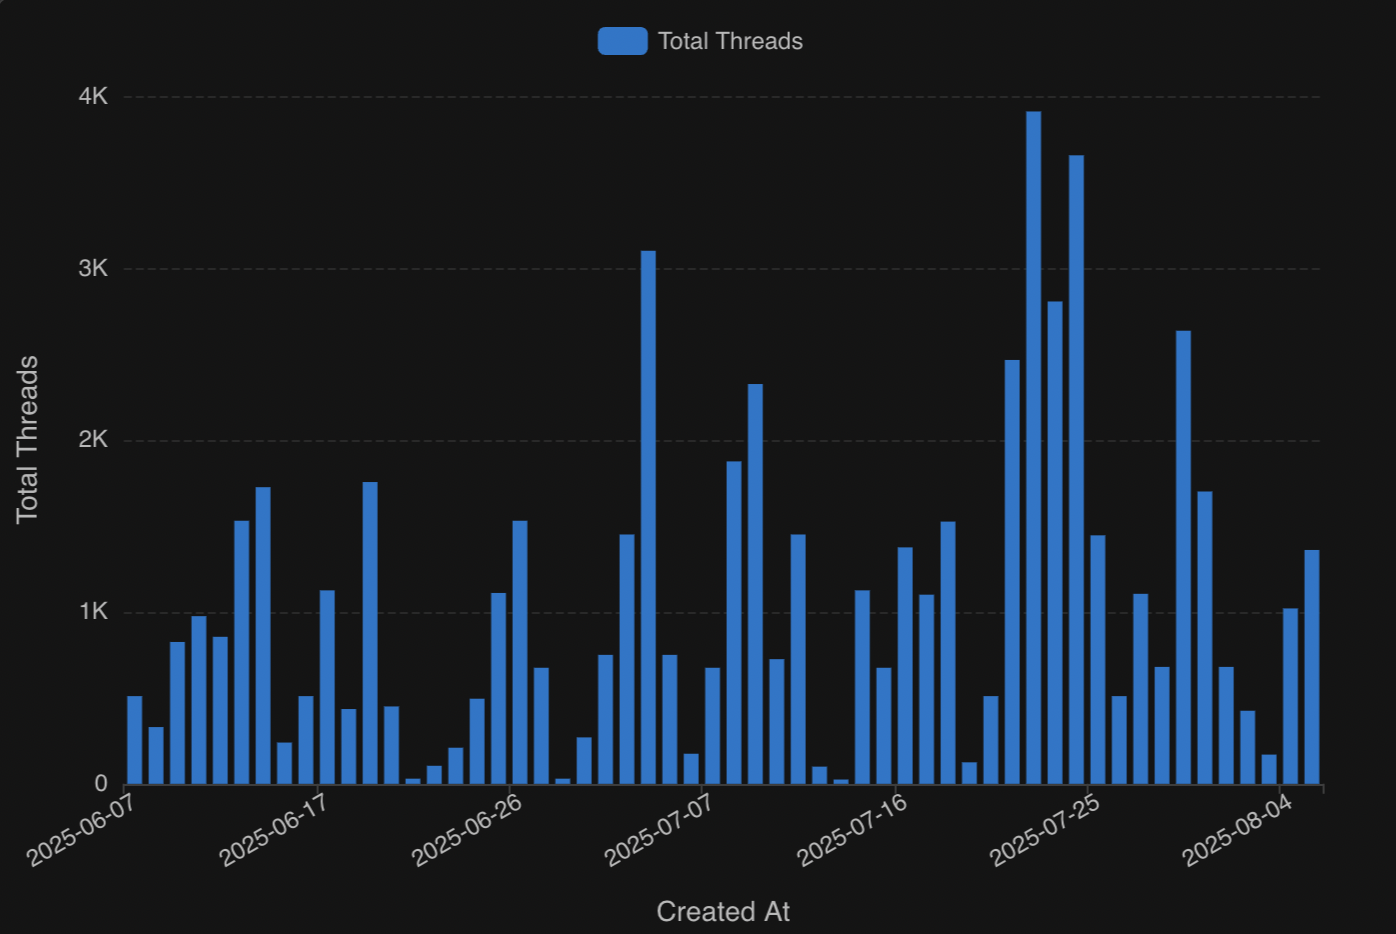
Now we can plot thread count over time easily by selecting "Total Threads" and "Created At" and creating a chart. One of the many benefits of Cube is that you can select any granularity (e.g. day, month, year) for time dimensions. Here I’m looking at total threads by day:
I also want to know how many tool calls and LLM calls are being made in each thread.
So let’s create metrics in the cube model for average tool calls and LLM calls per thread. A tool call is indicated by span_name = “running tool” and an LLM call is indicated by the model field being populated (this is what model was used for the LLM call). I’ll use the total threads (count(distinct trace_id) ) as the denominator.
      - name: avg_tool_calls
        type: number
        sql: sum(case when span_name = 'running tool' then 1 else 0 end)/(count(distinct trace_id))
        title: "Avg Tool Calls per Thread"

      - name: avg_llm_calls
        type: number
        sql: sum(case when model is not null then 1 else 0 end)/(count(distinct trace_id))
        title: "Avg LLM Calls per Thread"
Now I can plot these metrics to see how they change over time. In general, our tool calls and LLM calls are decreasing over time to about 2-3 per thread, which is roughly what we want.
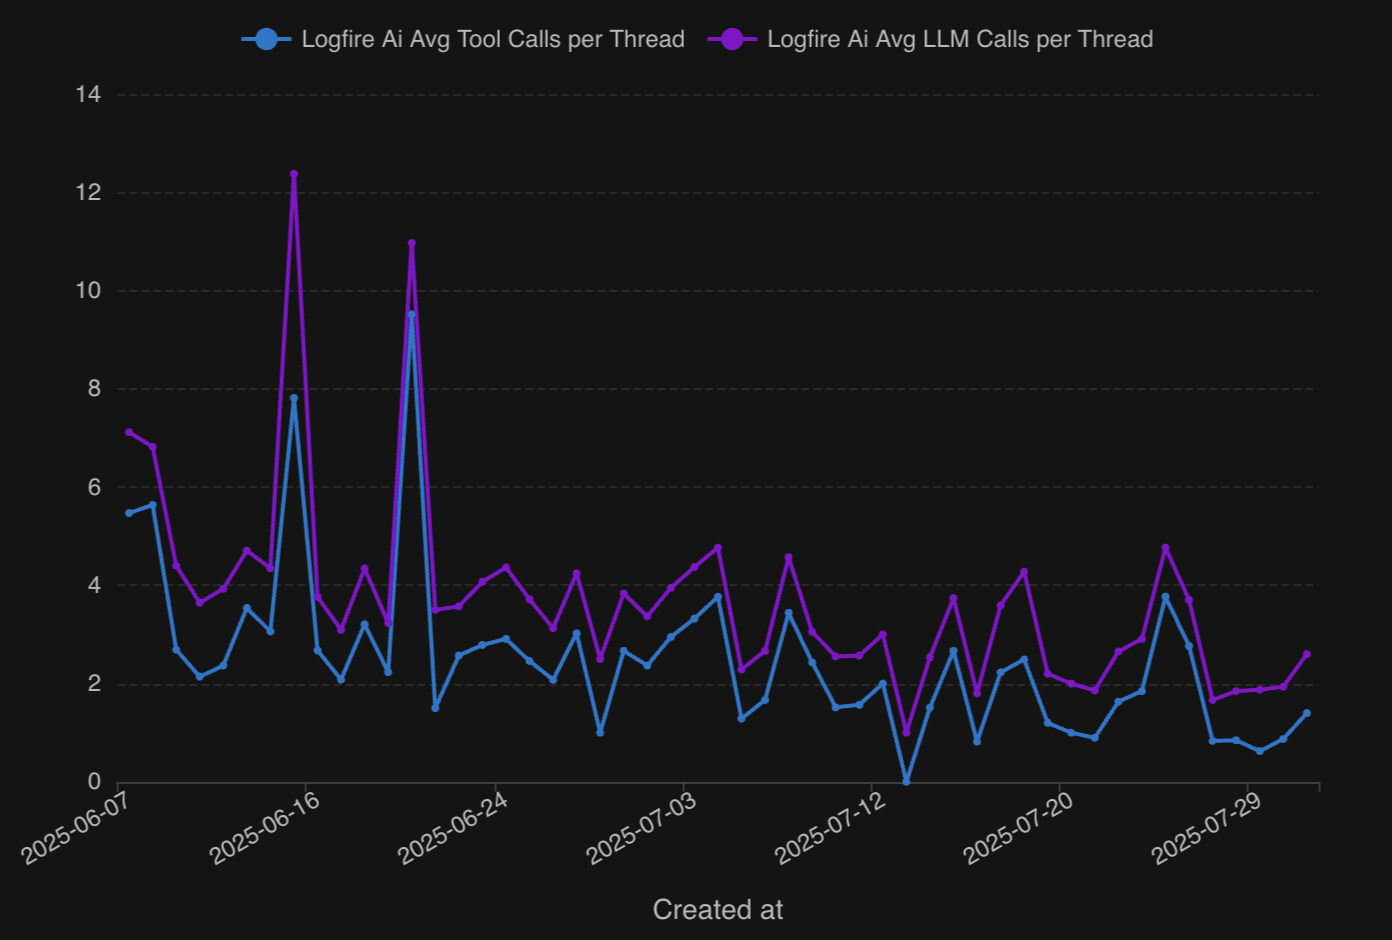
As you can see, there are always fewer tool calls than LLM calls. This is because there’s almost always one single tool call after each LLM call, except for the last LLM call, which summarizes the results of the thread.
I also want to see how long each thread is taking. We want to not only minimize LLM and tool calls, but minimize how long it takes our agent to arrive at an answer to user’s question.
To get the average thread duration, you want to look at the messages that don’t have a parent_span_id. There is always only one of these messages per thread—the main message—and each subsequent message is a “descendent” of that initial message. The duration of the that message is the duration of the whole thread. You could also look at the durations of individual tool and LLM calls to see if there’s any bottlenecks, but right now I just want to look at the duration of the whole thread.
I’ll add an avg_thread_duration measure to my cube model like this:
     - name: avg_thread_duration
       type: number
       sql: sum(case when parent_span_id is not null then duration else 0 end)/(count(distinct trace_id))
       title: "Avg Thread Duration"
And now I can plot the average thread duration alongside the tool/LLM calls per thread.
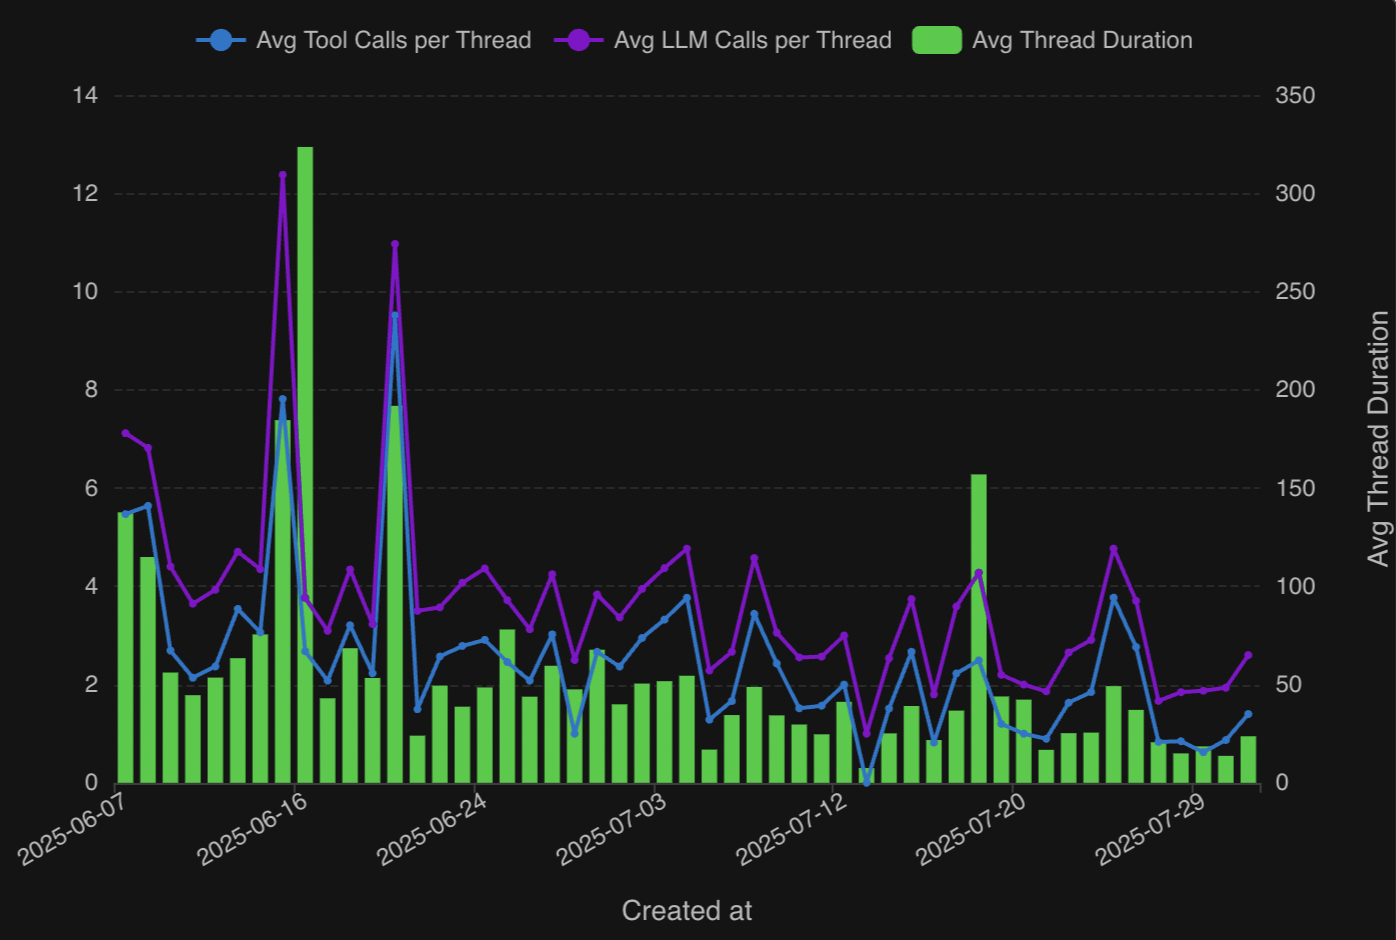
The duration appears to be closely correlated with the number of tool and LLM calls per thread, with a few exceptions, and lately averages under 30 seconds per thread.
I also want to see which tool calls are being made. We have a handful of tools our agent can call upon, including: create_cube_query which creates and runs a Cube query; run_sql_query ; a tool called introspect which is used to repair query errors; and a handful of other tools to help in the data analysis process.
A tool call message looks like “running tool: create_cube_query”, so to extract the tool call from a message you have to split the message field at “running tool: “.
That can be done with a split_part() SQL expression in the cube model:
      - name: tool
        sql: split_part(message, 'running tool: ', 2)
        type: string
Now we can look at the number of tool calls for each tool over any period of time.
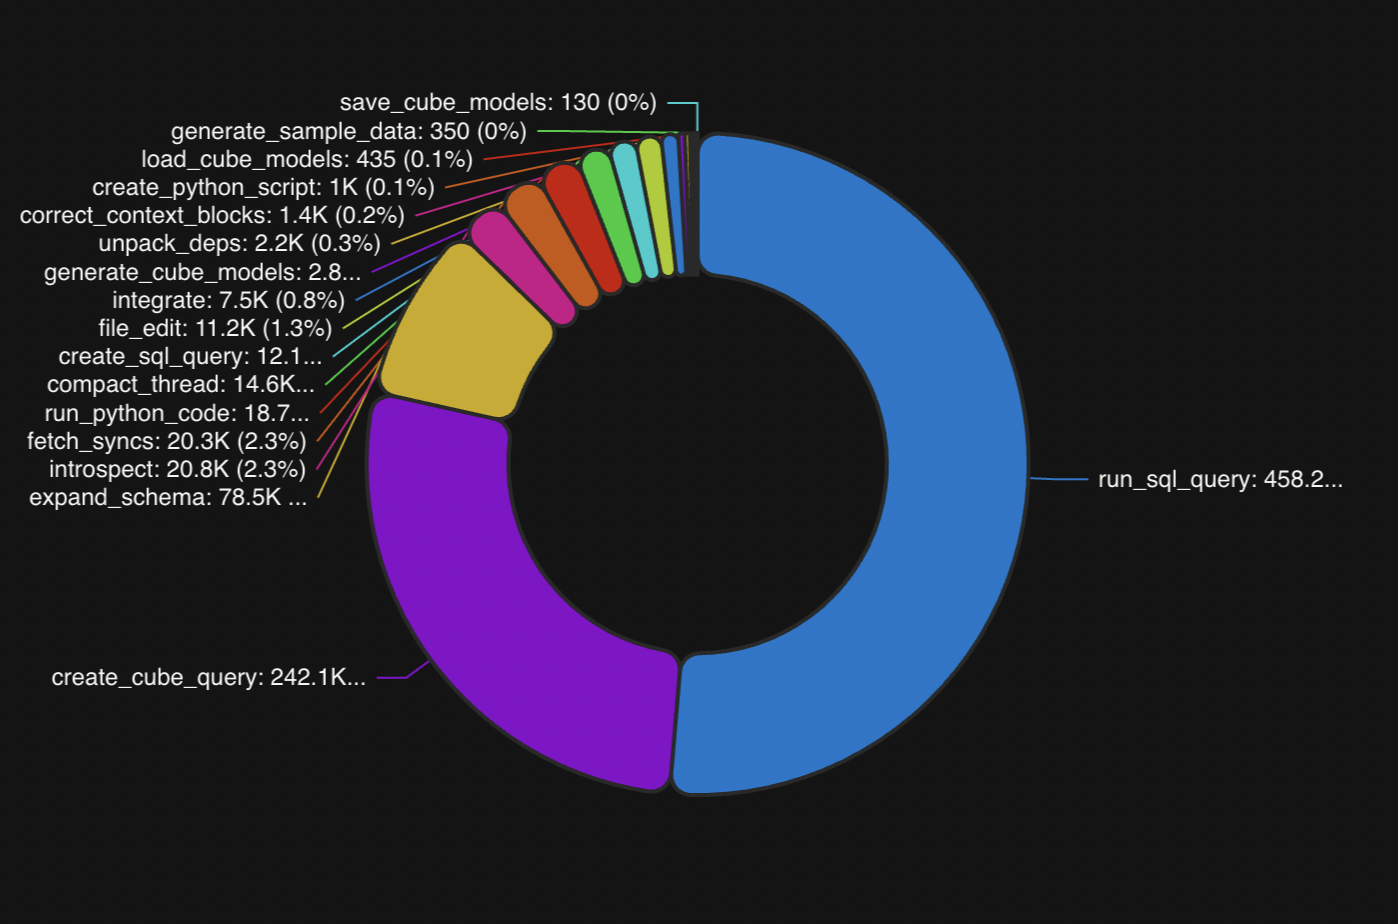
Clearly, our two most popular tools are run_sql_query and run_cube_query. This is expected since our data agent is programmed first and foremost to be a data analyst. But we are also running a number of other tool calls that help users with all stages of the data analysis process, including adding new integration sources, updating Cube models, and fetching data sync statuses.
Calculating LLM cost
Another important metric to track is input and output tokens, because they determine the cost of an LLM request.
Models are usually priced at cost per million tokens, with output tokens being roughly 4-5x the cost of input tokens (but there are usually fewer output tokens). For example, Claude 4 is $3 per million input tokens, and $15 per million output tokens.
I can create an input_token_cost dimension in my Cube model with a case when that multiplies the input tokens by the cost for each model. Here is an example with a few of the models we use:
      - name: input_token_cost
        sql: "case when model = 'gpt-4o-mini' then (input_tokens/1000000)*.15
            when model = 'gpt-4o' then (input_tokens/1000000)*2.5
            when model ilike 'claude-sonnet-4%' or model ilike 'claude-3%' or model ilike '%claude-4%' then (input_tokens/1000000)*3.0
            when model ilike 'claude-opus-4%' then (input_tokens/1000000)*15.0
            when model ilike 'gemini-2.5-flash%' then (input_tokens/1000000)*.3
            else 0 end"
        type: number
        format: currency
I did the same for output_token_cost and the created a cost dimension that adds the two together. Then I created a cost-per-thread measure by summing cost and dividing by the number of threads:
      - name: cost_per_thread
        type: number
        sql: sum({cost})/(count(distinct trace_id))
        format: currency
Now I can plot the average input tokens and output tokens per thread, alongside the cost per thread, over time.
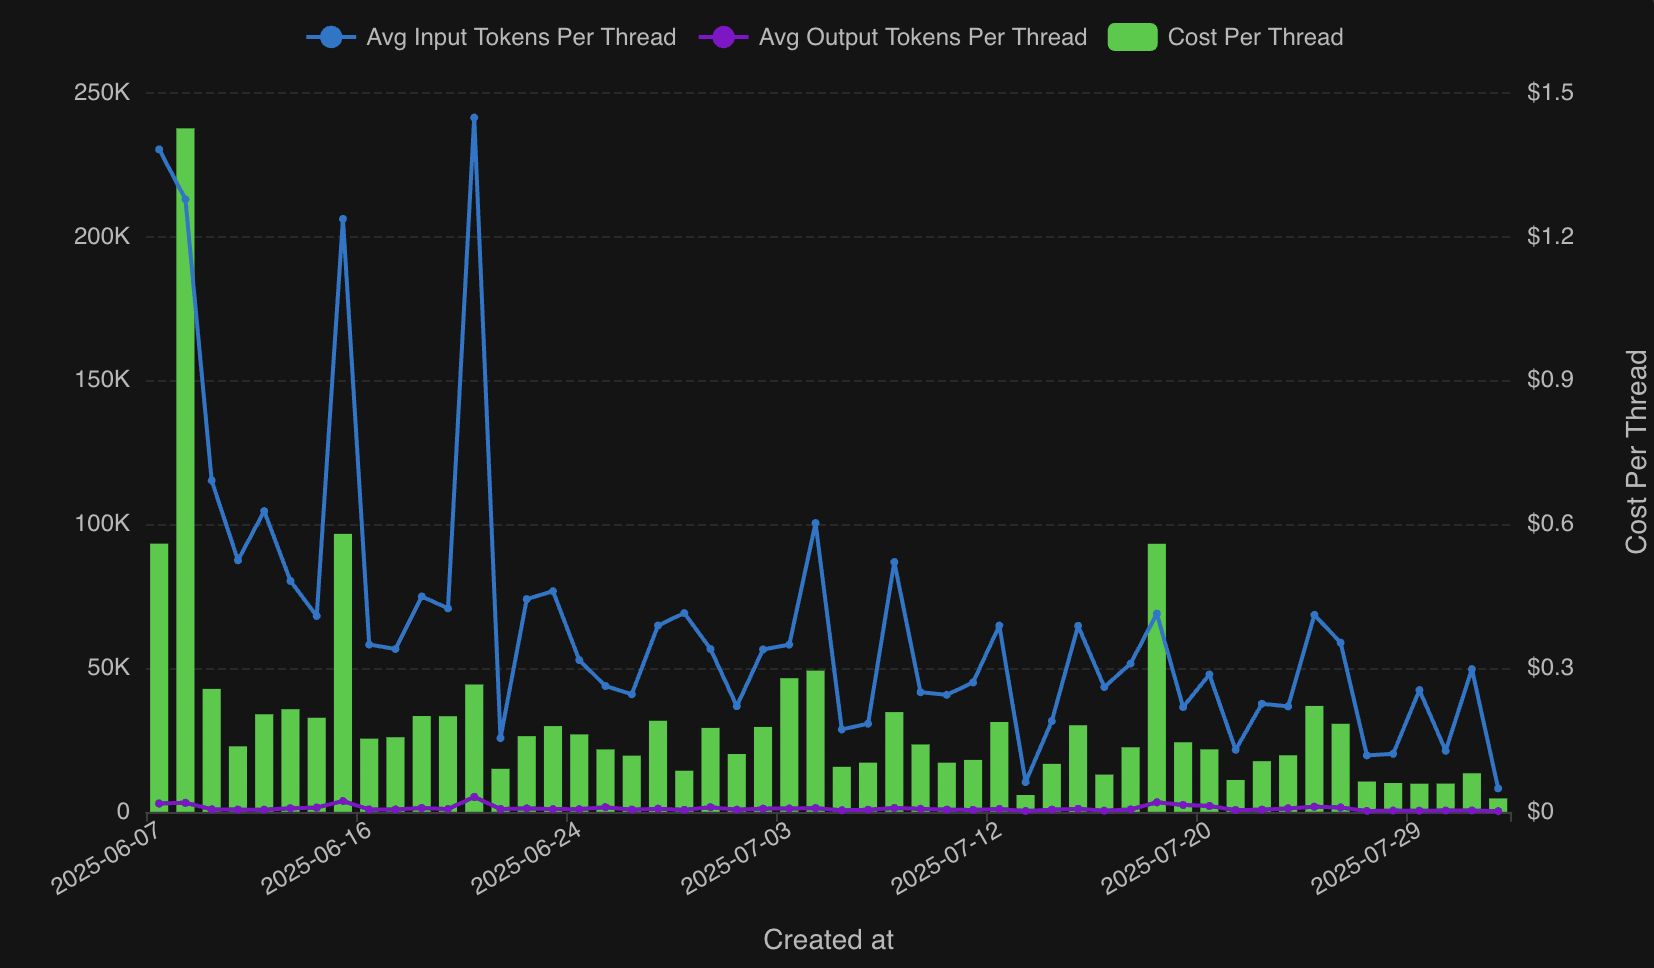
There have been some spikes here and there, but our cost-per-thread has been generally trending down as we’ve optimized our agent and found the best models for our use case.
Speaking of models, I can also break down cost-per-thread by model:
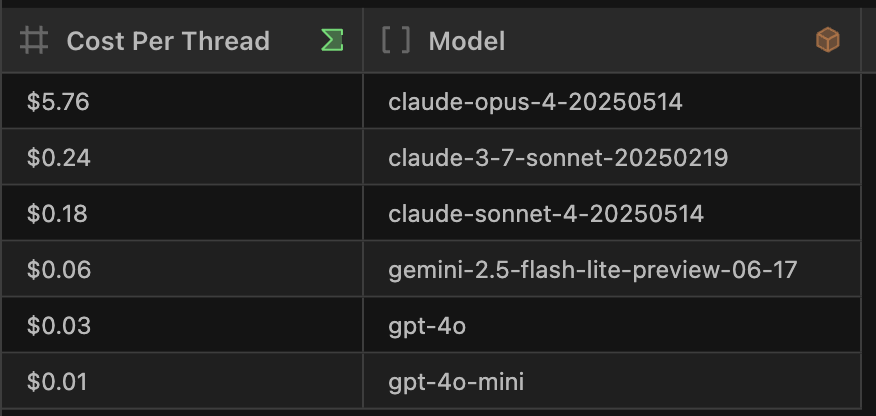
claude-opus-4 is very expensive and didn’t give us enough benefits in terms of speed and accuracy to justify its usage. But we found claude-4 to be around our sweet spot of a reasonable cost per token, while being fairly fast, concise, and performant.
This was just a taste of the kind of insights we’re able to gather from our AI agent logs. We can also track errors and create custom metrics for when a user query was answered successfully.
Best of all, we can even ask our own AI agent about our AI agent logs, such as “what was the average thread duration over the past 7 days?”.
Do you have AI agent logs you’re trying to make sense of?
I’ve walked through the basic architecture of our AI Data Agent, how we load and update agent logs in DuckLake, how we created a Cube semantic model to help explore the data, and some of the charts we use to monitor our AI agent.
If you want to make better sense of your AI agent logs—or any data for that matter—you can create a Definite account here. Shoot me an email at brian@definite.app, and we can help you load your data into DuckLake, build a semantic model, and get you started with informative reports and dashboards in no time.
For more on why we run agent workloads on DuckLake in the first place — and what the economics look like when you don't — Mike wrote The 2026 Math on AI Agents in Snowflake — and Why a Budget Cap Won't Fix It.